
Fig. 3. Graphical representation of freezing bouts by session and group for mice subjected to one trial of auditory delay or trace fear conditioning.
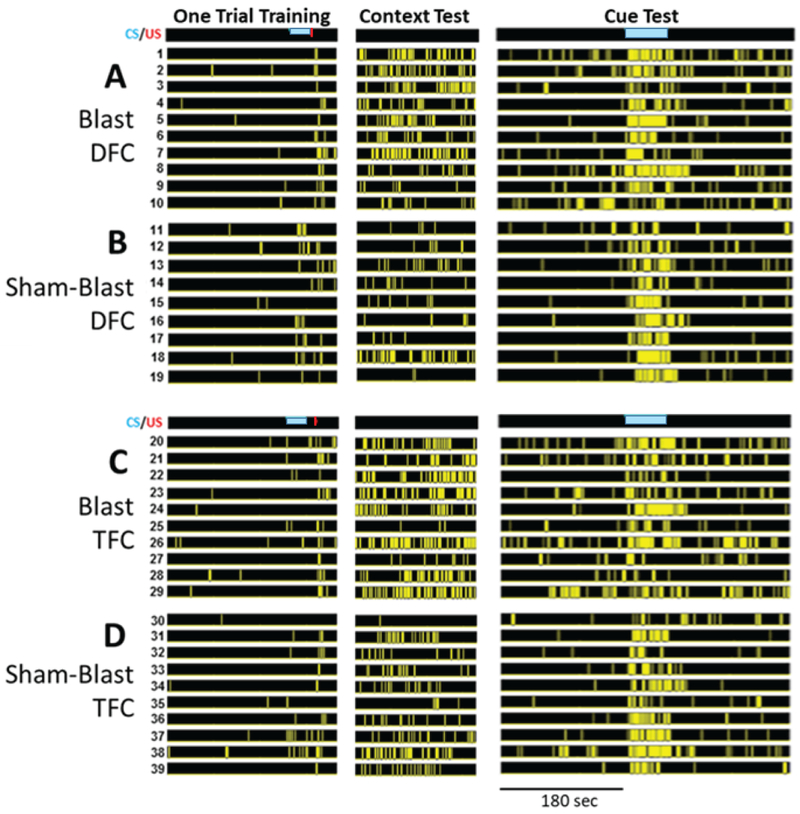
The timing of the conditioned stimulus (CS) (blue bar) is shown in the Training and Cue columns. The yellow bars in each subsequent row represent the timing of freezing bouts. Data are presented in a raster-type fashion such that each row represents the freezing behavior for each individual mouse. Columns represent the three phases of conditioning for each group, i.e., training, testing for contextual fear, and testing for cued fear including preCue freezing. A. Blast DFC: Blasted mice trained with delay fear conditioning (DFC). B. sham-Blast DFC: sham-blasted mice trained with DFC. C. Blast TFC: Blasted mice trained with trace fear conditioning (TFC). D. sham-Blast TFC: Sham-blasted mice trained with TFC. The 180 sec time scale applies to all three phases of the experiment.