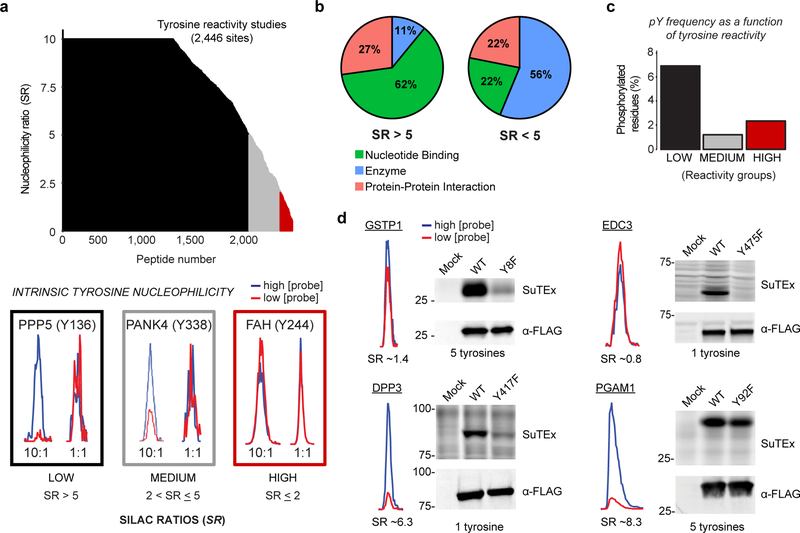
Figure 3. SuTEx-enabled discovery of intrinsically nucleophilic tyrosines in human cell proteomes.
HEK293T SILAC heavy and light soluble proteomes were treated with 250 or 25 μM HHS-465 (10:1 comparison), respectively. The resulting SILAC ratios (SR) were quantified using the area under the curve of MS1 extracted ion chromatograms (EIC) to determine tyrosine nucleophilicity. a) A waterfall plot of nucleophilicity ratio (median SR values) as a function of probe-modified tyrosine sites to quantitate tyrosine reactivity across the proteome. A MS1 EIC is shown for SR values that represent each nucleophilicity group (low, black; medium, grey; high, red). b) Distribution of protein domain groups that contain tyrosines quantified as low (SR >5) or medium/high (SR <5) reactivity. Domain annotations shown were significantly enriched (Q-value < 0.01 after Benjamini–Hochberg correction of a two-sided binomial test) with HHS-465. c) Bar plot depicting tyrosines with medium to high nucleophilicity are less likely to be phosphorylated (HTP ≥10, PhosphoSitePlus) compared with less-reactive tyrosines. d) Proteins containing a hyper-reactive tyrosine (GSTP1 Tyr8, EDC3 Tyr475) or single probe-modified tyrosine (DPP3 Tyr417) can be site-specifically labeled with SuTEx probes (50 μM, 30 min, 37 °C). Recombinant wild-type (WT) protein or corresponding tyrosine (Y)-to-phenylalanine (F) mutant HEK293T proteomes were treated with HHS-475 (GSTP1, DPP3, PGAM1) or HHS-465 (EDC3) and analyzed by gel-based chemical proteomics. Proteins that contain less-nucleophilic tyrosines (PGAM1 Tyr92) are labeled at multiple sites and show negligible differences in probe labeling between WT and tyrosine mutant. Western blots show equivalent expression of recombinant WT and mutant proteins. Full images of gels and blots are shown in Supplementary Figure 27. All data shown are representative of two experiments (n=2 biologically independent experiments).

