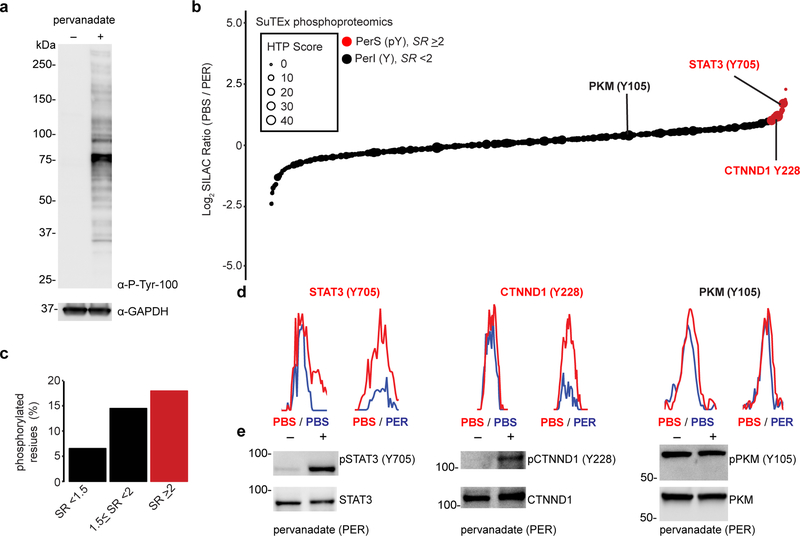
Figure 6. Chemical phosphotyrosine-proteomics by SuTEx.
a) Western blot analysis confirming activation of global tyrosine phosphorylation (detected via a phospho-tyrosine monoclonal antibody, P-Tyr-100) with pervanadate treatment conditions of A549 cells (100 μM, 30 min) used for chemical proteomic studies. b) Plot of HHS-475-modified tyrosine sites (represented by individual circles) as a function of SILAC ratios (SR, light (PBS)/heavy (pervanadate or PER)). Size of circles reflect the HTP score (PhosphoSitePlus). Tyrosine sites were further segregated into pervanadate-insensitive (PerI) and pervanadate-sensitive (PerS) groups based on SR <2 or ≥2, respectively. Soluble proteomes from pervanadate-activated A549 cells were labeled with HHS-475 (100 μM) for 30 min at 37 °C. c) Bar plot showing trend towards increased number of phosphotyrosine annotations (HTP ≥10) on tyrosine sites with enhanced pervanadate sensitivity. d,e) Validation that blockade of HHS-475 labeling (d) of individual tyrosine sites on STAT3 (Tyr705), CTNND1 (Tyr228), and PKM (Tyr105) coincides with increased phosphorylation at respective sites with pervanadate activation (e). Equivalent protein loading was confirmed by western blot analysis of non-phosphorylated protein counterparts. See Online Methods for additional details of pervanadate activation and phosphotyrosine western blot procedures. See Supplementary Dataset 1 for SR values of tyrosines sites detected by chemical proteomics. Full images of blots are shown in Supplementary Figure 28. All data shown are representative of two experiments (n=2 biologically independent experiments).

