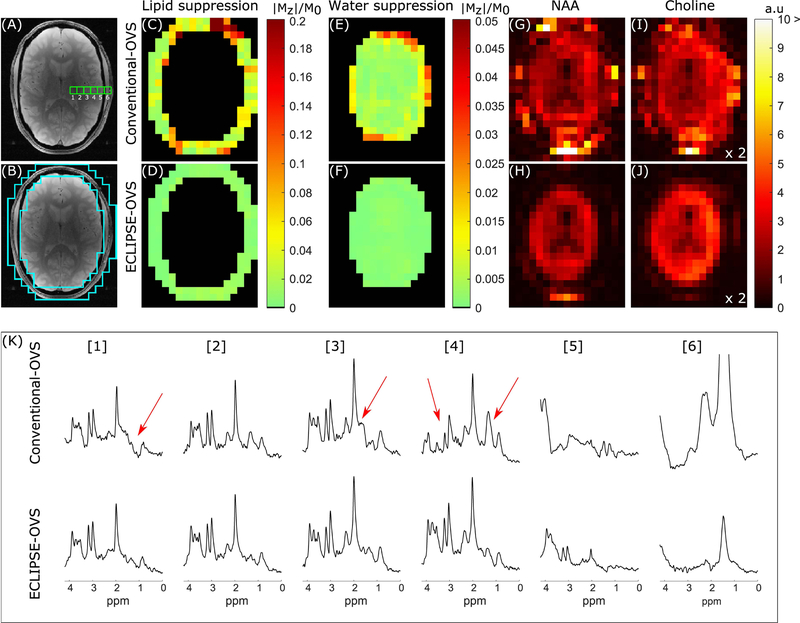
FIG. 4.
Summary of conventional-OVS and ECLIPSE-OVS sequence performance on one volunteer. (A) Anatomical axial slice corresponding to the region used for MRSI illustrating six adjacent MRS voxel locations compared in (K). (B) The ROI used to calculate extracranial lipid suppression in (C–D). (C–D) Residual extracranial lipid fraction maps for the conventional-OVS and ECLIPSE-OVS sequences, respectively. The conventional-OVS method shows hotspots as predicted in simulation, with mean suppression of ~18-fold (mean/median |Mz|/M0 of 0.054/0.034, respectively). ECLIPSE-OVS in comparison, demonstrates excellent lipid suppression with a mean suppression factor of ~135-fold (mean/median |Mz|/M0 of 0.0074/0.0073, respectively) with no hotspots. (E–F) Mean water suppression factors for conventional-OVS within the brain were ~137-fold (mean/median |Mz|/M0 of 0.0073/0.0041, respectively), with hotspots ~0.05. In comparison, the ECLIPSE-OVS sequence demonstrates superior water suppression with a mean suppression factor ~870-fold (mean/median |Mz|/M0 of 0.0011/0.0010, respectively). (G–H) NAA and (I–J) choline maps calculated for the two methods. (K) Spectra from the 6 adjacent voxels shown in (A) were selected to start from predominantly a ventricular area (voxel 1), moving towards white/gray matter (voxel 3, 4), and finally moving out to the extracranial lipid region (voxels 5, 6). Voxels 1–4 with conventional-OVS show prominent metabolites (NAA, creatine, and choline) with noticeable artifacts (marked with red arrows); in comparison no such contaminants are observed from voxels 1–4 with ECLIPSE-OVS. Lipid contaminants in voxel 6 is seen to be below the amplitude of NAA in brain for ECLIPSE-OVS, but beyond the displayed bounds for conventional-OVS.

