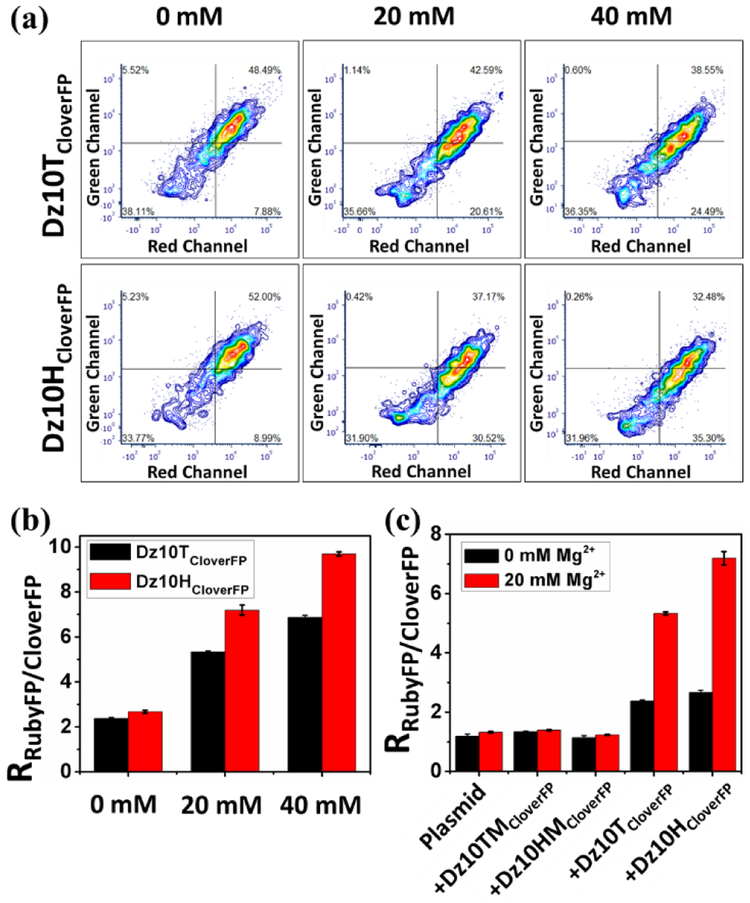
Figure 4.
(a) The contour charts of flow cytometry when Dz10TCloverFP or Dz10HCloverFP was applied to different concentrations of Mg2+. (b) Fluorescent signal ratio of RubyFP to CloverFP in different concentrations of Mg2+ when Dz10TCloverFP or Dz10HCloverFP was used. (c) Comparison of the ratio generated by Dz10TCloverFP or Dz10HCloverFP and Dz10TMCloverFP or Dz10HMCloverFP in the absence or presence of Mg2+.

