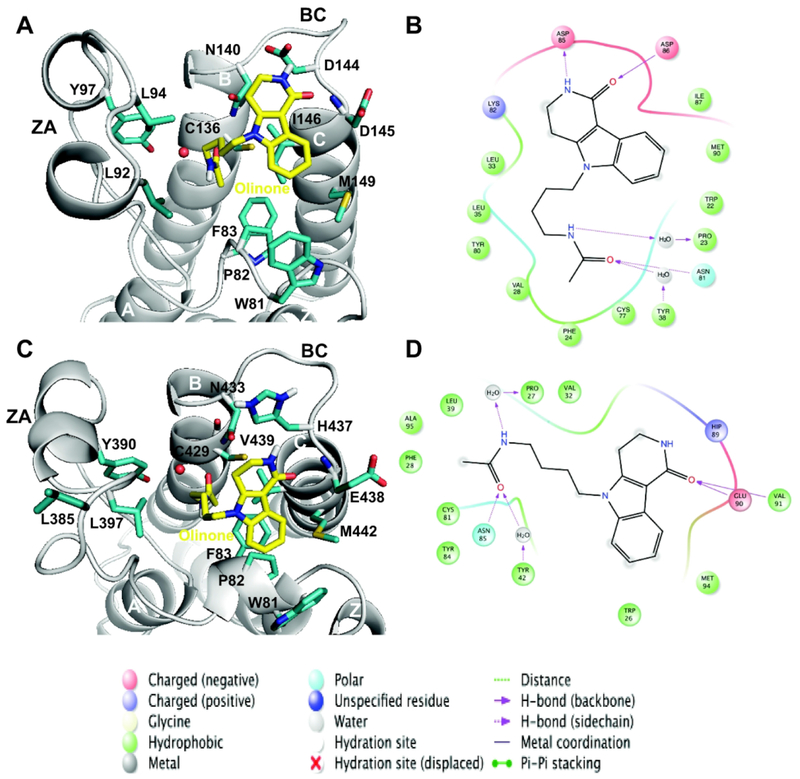
Figure 3. Main interactions for the AcK binding site of BRD4 BrD1|2.
Three–dimensional representation of representative structures of the BRD4 BrD1|2/Olinone complexes: (A) BRD4 BrD1/Olinone and (C) BRD4 BrD2/Olinone (rendered using PyMOL program34). Each representative structure was obtained using the average-linkage algorithm within the cluster command in cpptraj in AMBER. The whole MD simulation for each ligand was grouped together to produce one cluster using the pairwise RMSD between frames as a metric comparing the all acetyl-lysine binding site and MSi ligand atoms. The water molecule for each complex is depicted as red sphere. Schematic diagram of main ligand interactions: BRD4 BrD1|2/Olinone complexes: (B) BRD4 BrD1/Olinone and (D) BRD4 BrD2/Olinone (rendered using Ligand Interaction Diagram in Maestro 2016-122). In case of BRD4 BrD1 (B), to align the residues numbering depicted in the figure to the ones in BRD4 BrD1/H4K5ac/K8ac X-ray crystal structure (PDB ID 3UVW19), 59 units should be added to the figure residues numbering. In case of BRD4 BrD2 (D), to align the residues numbering depicted in the figure to the ones in BRD4 BrD2 X-ray crystal structure (PDB ID 2OUO19), 348 units should be added to the figure residues numbering.

