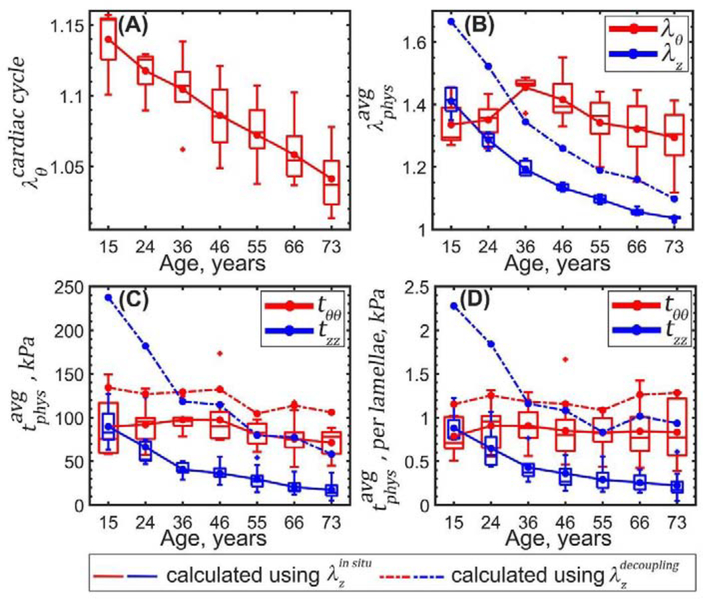
Figure 10:
Changes in the TA physiologic stress-stretch state with age. (A) Changes with age in stretch experienced during the cardiac cycle from diastole (80 mmHg) to systole (120 mmHg). (B) Circumferential θ (red) and longitudinal z (blue) physiologic stretches and (C) stresses at 100 mmHg calculated using stress-free state as a reference; and (D) average physiologic stress per elastic lamellae unit in the circumferential (red) and longitudinal (blue) directions determined using (solid lines) and (dashed lines).

