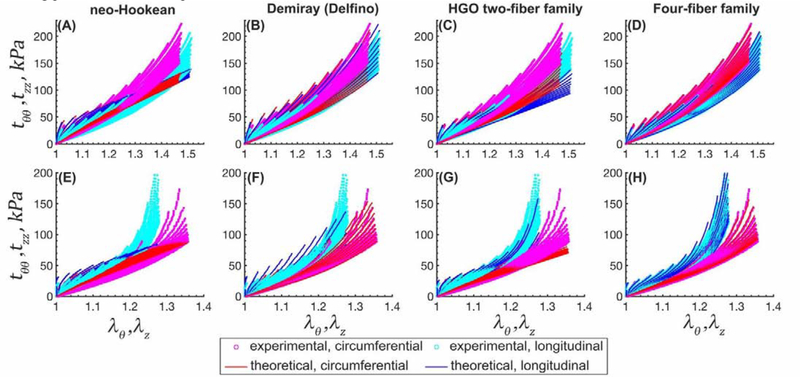
Figure 12:
Experimental stress-stretch data from 19 different biaxial loading protocols (cyan [longitudinal] and magenta [circumferential] dots) and model fits (solid blue [longitudinal] and red [circumferential] lines) for a 14 (top row) and 44 (bottom row) year-old TAs. (A,E) neo-Hookean, (B,F) Demiray (Delfino), (C,G) HGO two-fiber family, and (D,H) four-fiber family models. Please note that the stretch axes limits are different for the top and bottom plots.

