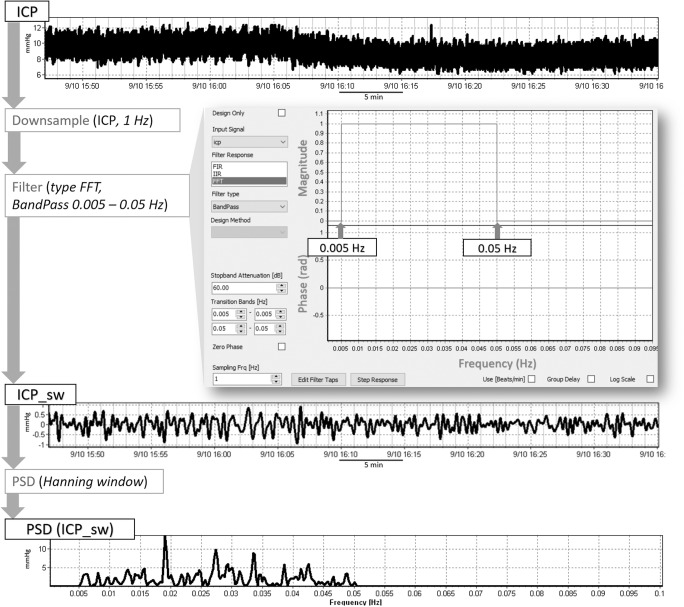
Fig. 1.
Signal processing methodology applied to obtain the slow wave component of the recorded signals. The whole pipeline is shown here for ICP. The raw waveform signals (time trend at the top) were first decimated to sampling frequency 1 Hz and subsequently processed with a FFT band-pass filter designed as shown in the picture, in order to isolate the slow wave component (0.005–0.05 Hz) of the four waveforms. Power spectral density (PSD) analysis was performed (periodogram method with the settings as shown in the picture)

