Figure 2.

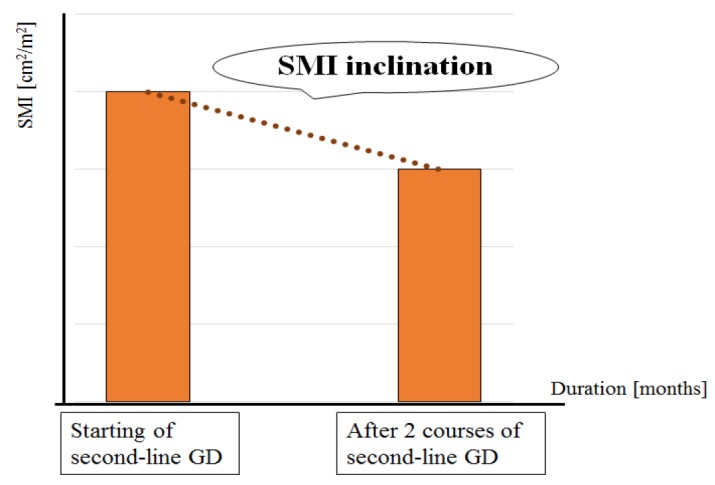
SMI Inclination is Defined as the Rate of Change in SMI Over the Duration between Imaging Visits. In this study, the second visit took place after two courses of second-line GD chemotherapy

SMI Inclination is Defined as the Rate of Change in SMI Over the Duration between Imaging Visits. In this study, the second visit took place after two courses of second-line GD chemotherapy