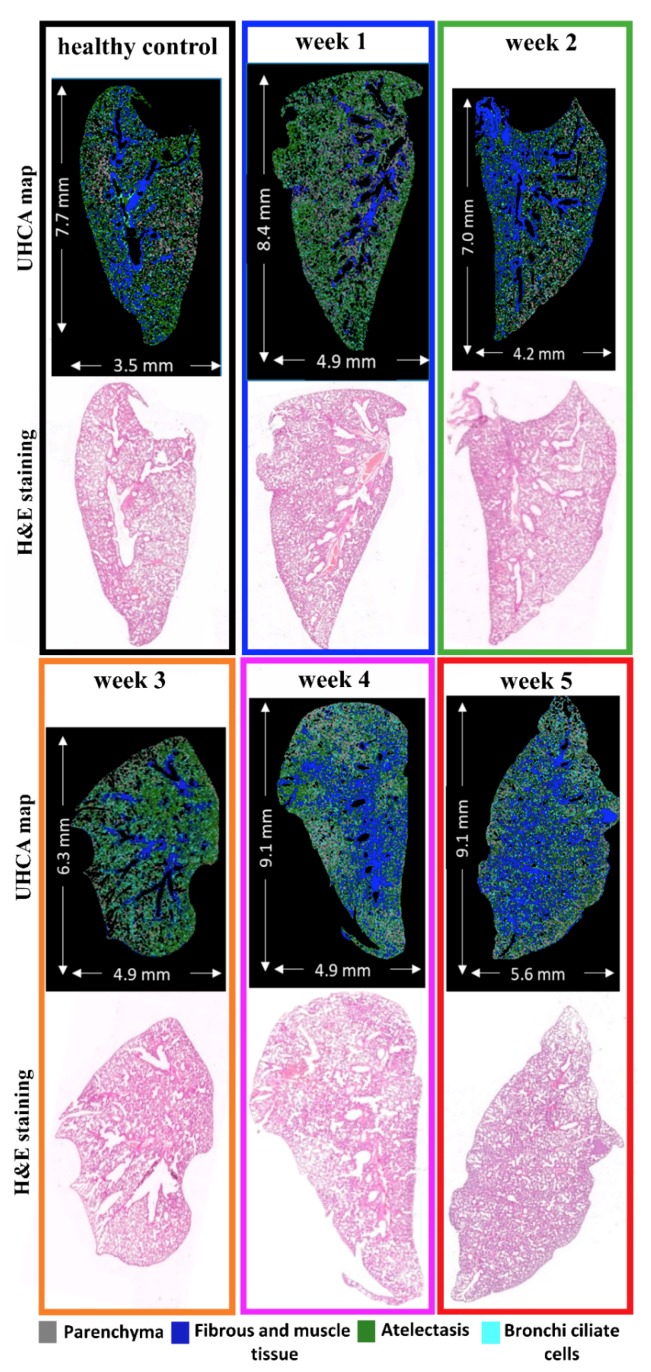
Figure 1.
Comparison of false-color unsupervised hierarchical cluster analysis (UHCA) maps with hematoxylin and eosin (H&E) microphotographs collected from lung cross-sections. UHCA classification of the most abundant tissue types in lungs: parenchyma (grey), atelectasis (green), fibrous/muscular tissue (blue), and bronchi ciliated cells (aqua) corresponds to tissue structure observed in the H&E images. Magnified microphotographs after H&E staining with marked tissue types are shown in Figure S2 in Supplementary Materials.

