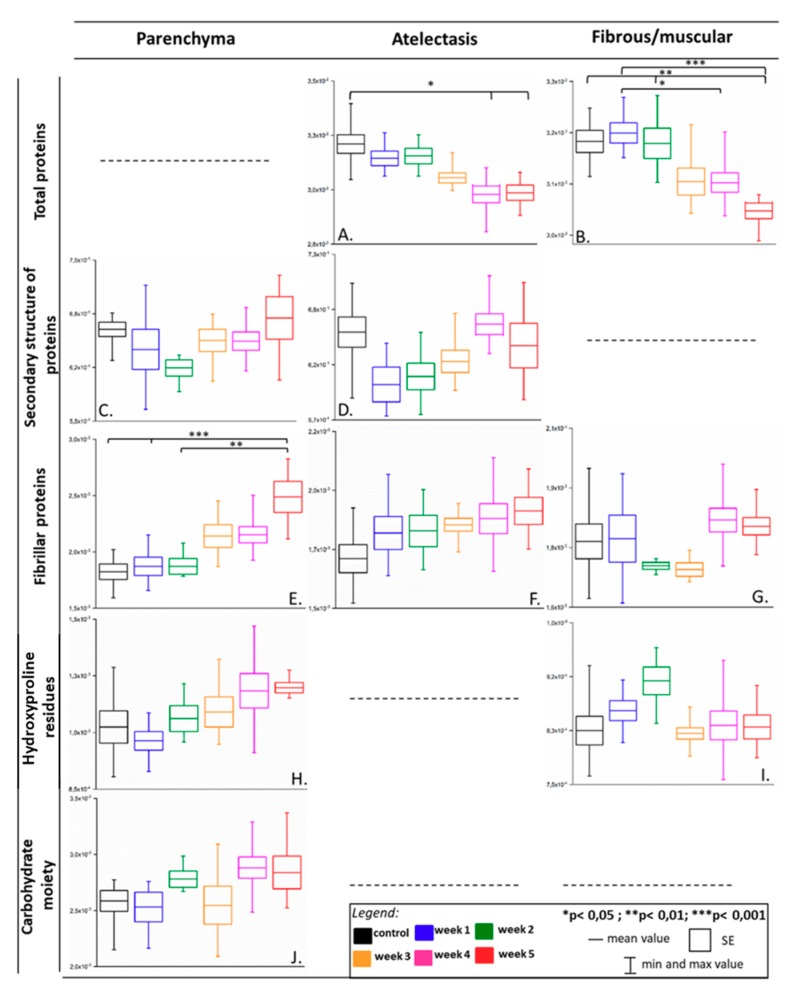
Figure 3.
Box diagrams of integral intensities for the selected bands showing biochemical changes in parenchyma, atelectasis, and fibrous/muscular tissue in the metastasis progression in the lungs. Integration regions: total proteins [(1707–1608 cm−1) + (1589–1485 cm−1)], secondary structure of proteins [(1589–1485 cm−1)/(1707–1608 cm−1)], fibrillar proteins (1286–1193 cm−1), hydroxyproline residues (1187–1140 cm−1), carbohydrate moieties (1137–1015 cm−1). The bands’ assignment is given in Table 2.

