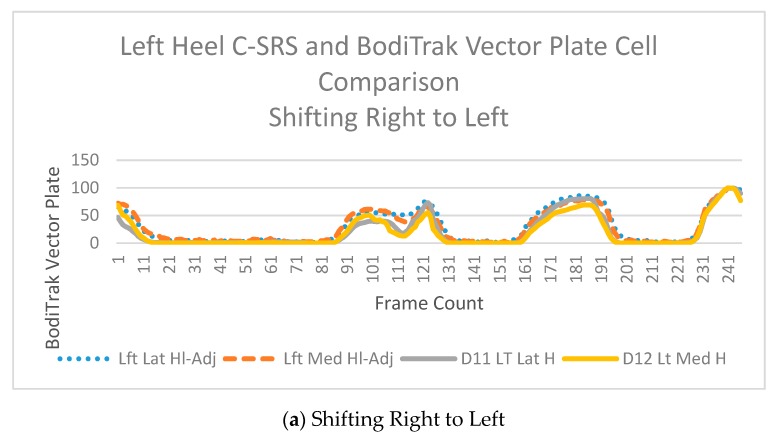
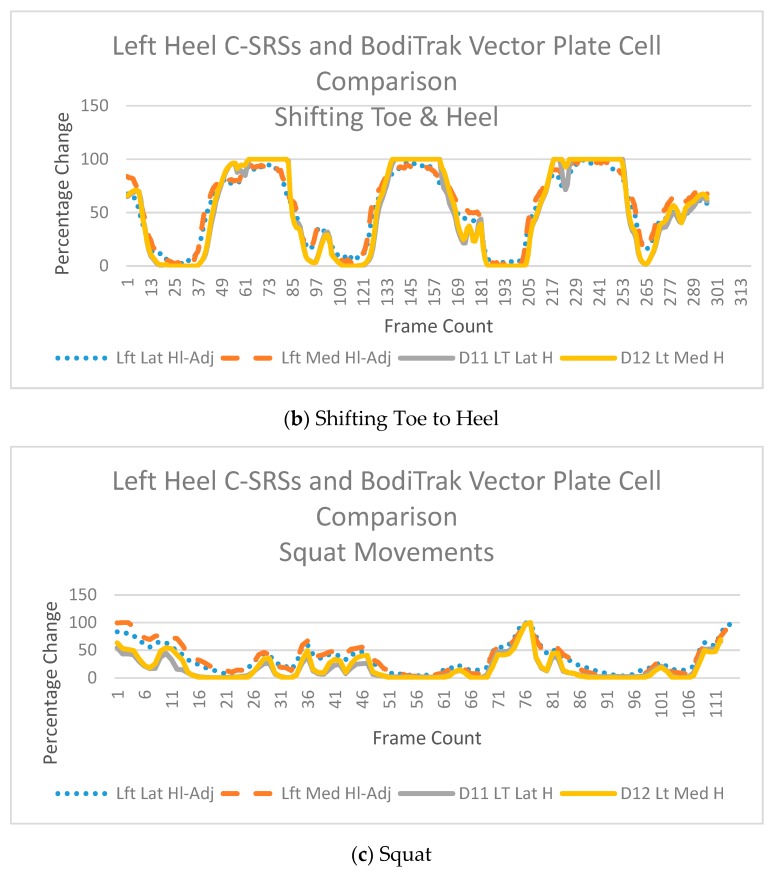
Figure 4.
Sample data graphed to show percentage change comparisons of BodiTrakTM Vector Plate cells and left heel C-SRSs in the A/P orientation during (a) shifting right to left, (b) shifting toe to heel, and (c) squatting. The vertical axis represents percentage of change from minimum and maximum over horizontal axis of time. The blue line represents the left lateral heel sensor; the orange line represents the left medial sensor. The grey line represents the individual BodiTrakTM Vector Plate cell (D11) which correlates to the lateral left heel sensor. The yellow line represents the individual BodiTrakTM Vector Plate cell (D12) which correlates to the left medial sensor.


