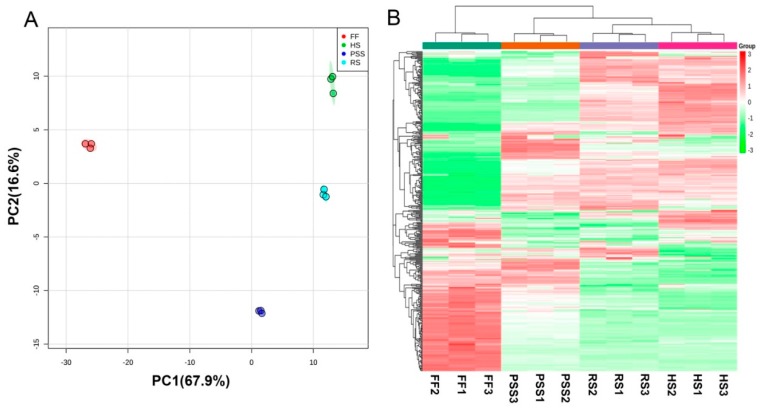
Figure 3.
Score plot of principal components analysis (PCA) (A) and heatmap of hierarchical cluster analysis (HCA) (B) showing that the leaf development regulated E. Pubescens foliar metabolites. The abbreviated stage name and observation dates were the same as described in Figure 1. HS in metabolomic analysis referred to leaf samples collected on 27 June.

