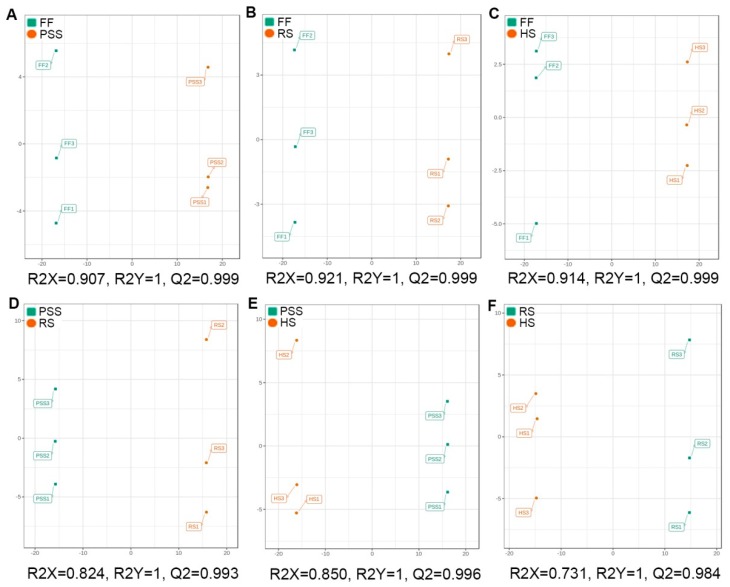
Figure 4.
Score plots of orthogonal partial least squares discriminant analysis (OPLS-DA) for six pairwise comparisons. R2X and R2Y were cumulative modeled variation of all R2Xs and R2Ys, separately, and Q2 was the cumulative predicted fraction. The abbreviated stage name and observation dates were the same as described in Figure 3. (A) PSS vs FF; (B) RS vs FF;(C) HS vs FF;(D) PSS vs RS;(E) PSS vs HS;(F) RS vs HS.

