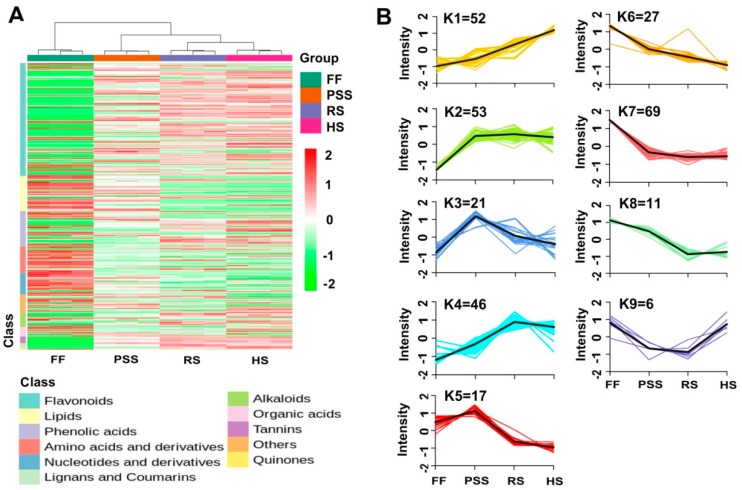
Figure 6.
HCA (A) and K-means (B) cluster analysis showing the dynamic accumulation of 302 differential metabolites across four representative growth stages. K-means cluster was performed on Z-score normalized intensities. The abbreviated stage name and observation dates were the same as described in Figure 3.

