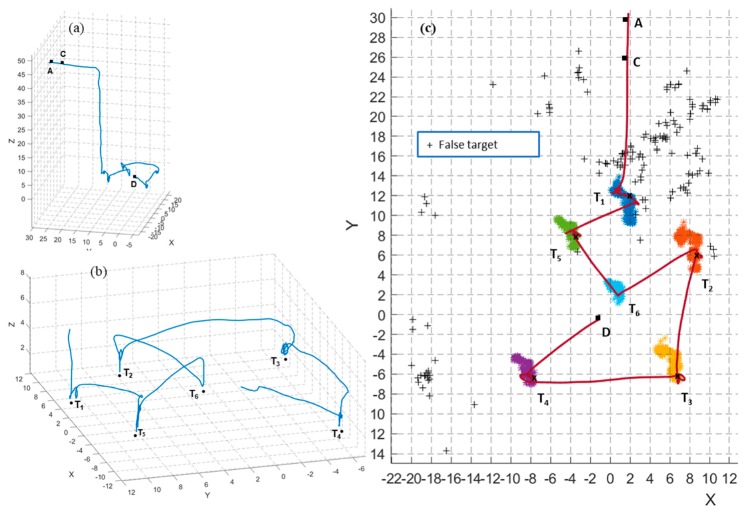
Figure 12.
Results from flight test 5: (a,b) 3D view of the flight trajectory in full and zoomed view of the visiting targets and action part; (c) Top view of the flight trajectory and scatter plot of estimated target positions in the full mission of flight test 5. (+) indicates false targets. (x) indicates the estimated position of the target when the UAS was performing the inspection (hovering above the target). Waypoint B is omitted to increase the clarity of the plots.

