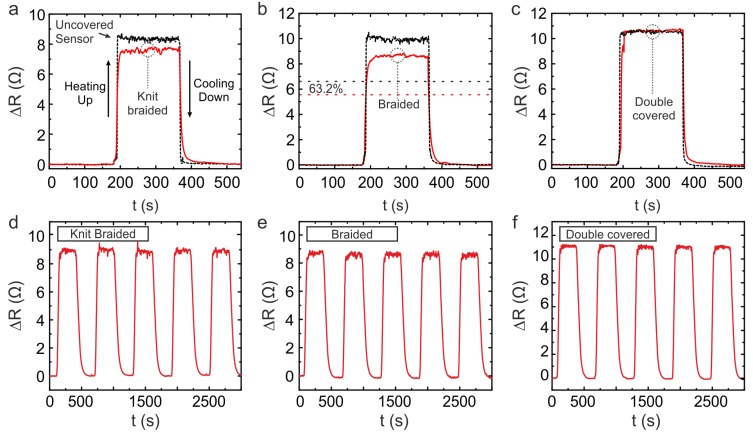
Figure 4.
Response time and cyclic experiments for the yarns. For response time experiments, a representative comparison before and after embedding the thin-film temperature sensors into the yarns is presented. The measurements of response time from the knit-braided, braided, and double-covered yarns before and after they were covered are shown in (a–c), respectively. The thermal time constant corresponds to the time taken by the sensor’s resistance to reach 63.2% of the final value once a sensor is subjected to a step change from ambient temperature to 40.0 °C and vice versa. This is indicated by the horizontal dashed lines in (b) which correspond to 63.2% of the maximum value. Finally, (d–f) are the results from the cyclic tests conducted on the knit-braided, braided, and double-covered yarns, respectively, where the temperature was cycled from 20.0 °C to 40.0 °C for 5 cycles.

