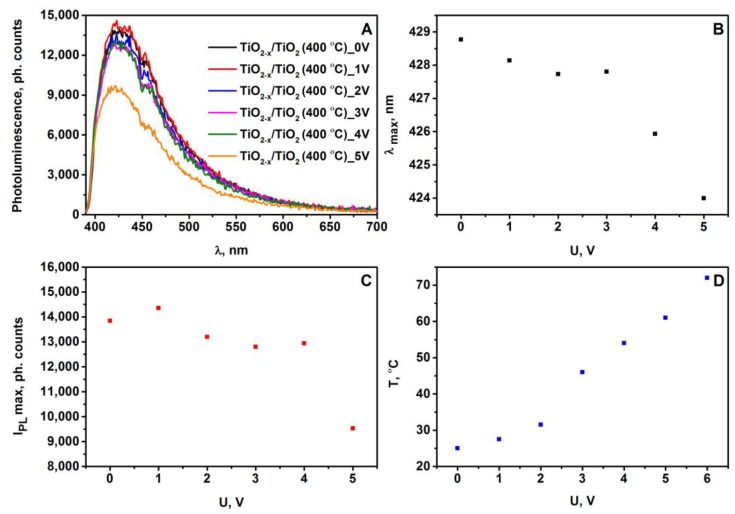
Figure 6.
(A) Photoluminescence spectra of TiO2-x/TiO2 (400 °C)-based sample at different applied voltage; (B) The changes in spectral position of photoluminescence maximum vs. voltage of TiO2-x/TiO2 (400 °C)-based sample; (C) The changes in photoluminescence maximum intensity vs. voltage of TiO2-x/TiO2 (400 °C)-based sample; (D) The plot of temperature vs. voltage of TiO2-x/TiO2 (400 °C)-based sample.

