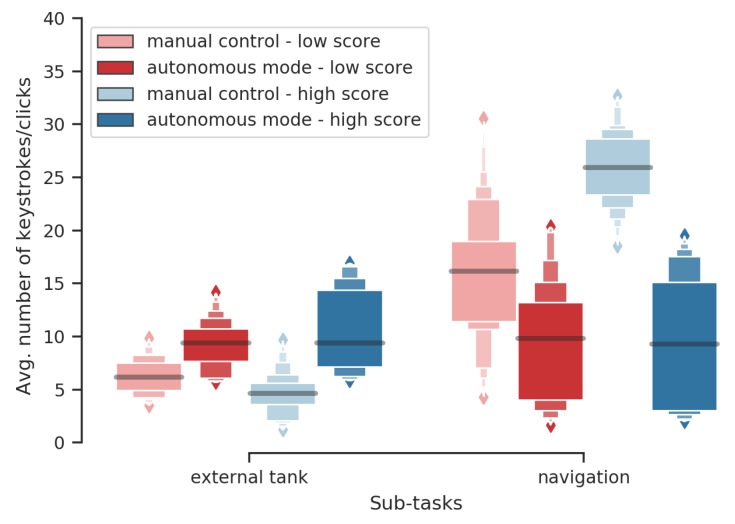
Figure 6.
Average number of keystrokes/clicks per sub-task (filling the external tank and driving the robot) during autonomous mode and manual control given performance groups. These graphical representations reappear in the next figures. They show a large number of quantiles, which makes it easier to visualize nonparametric distributions.

