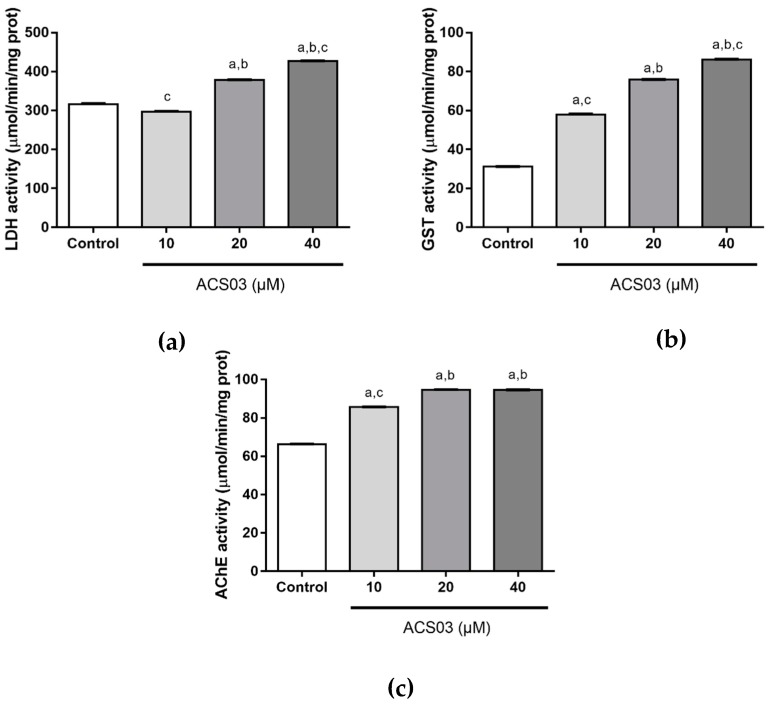
Figure 1.
Biomarker activities (mean value ± standard error) in zebrafish larvae after 96 h exposure to different concentrations of ACS03 (n = 4). (a) Lactate dehydrogenase (LDH) activity; (b) Glutathione S-transferase (GST) activity; (c) Acetylcholinesterase (AChE) activity. a p < 0.05 compared to control group, b p < 0.05 compared to ACS03 10 µM. c p < 0.05 compared to ACS03 20 µM (one-way ANOVA followed by Tukey’s multiple comparison test, p < 0.05).

