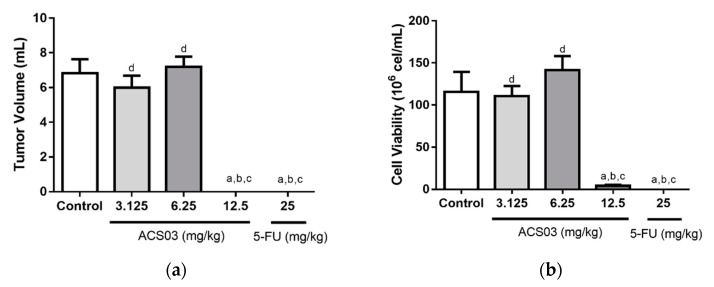
Figure 2.
Effect of ACS03 (3.125, 6.25, or 12.5 mg/kg) on (a) tumoral volume and (b) cell viability. Data are presented as mean ± standard error of mean (SEM) of six animals analyzed by analysis of variance (ANOVA) followed by Tukey’s test. a p < 0.05 compared to tumor control group, b p < 0.05 compared to 3.125 mg/kg dose. c p < 0.05 compared to compared to 6.25 mg/kg dose. d p < 0.05 compared to compared to 12.5 mg/kg dose.

