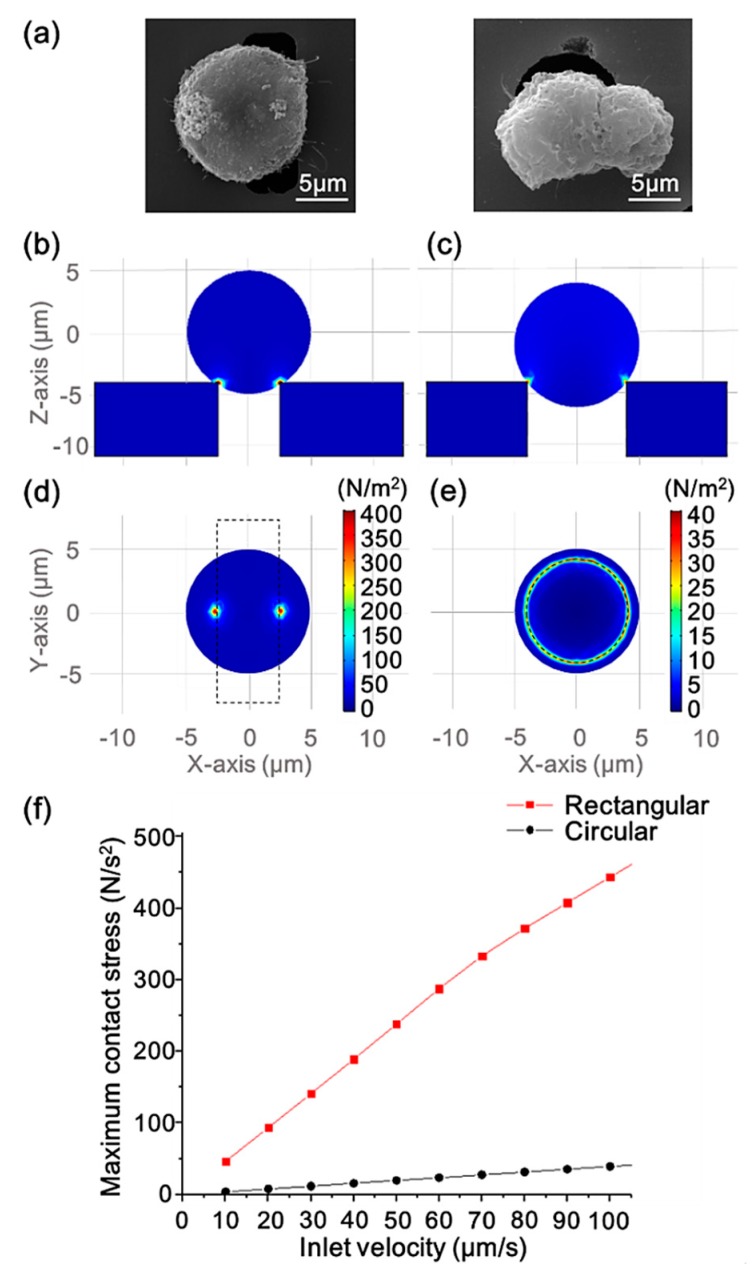
Figure 4.
(a) SEM micrographs of Hela cells clogged on the rectangular (left) and circular (right) pore. (b) The side views of the surface contact stress of a trapped cell interacting with the rectangular pore and (c) with the circular pore at the inlet flow velocity of 100 μm/s. (d) The bottom views of the surface contact stress of a trapped cell interacting with the rectangular pore and (e) with the circular pore at the inlet flow velocity of 100 μm/s. (f) The maximum contact stress of the cell surface versus the inlet flow velocity of the two pore geometry scenarios.

