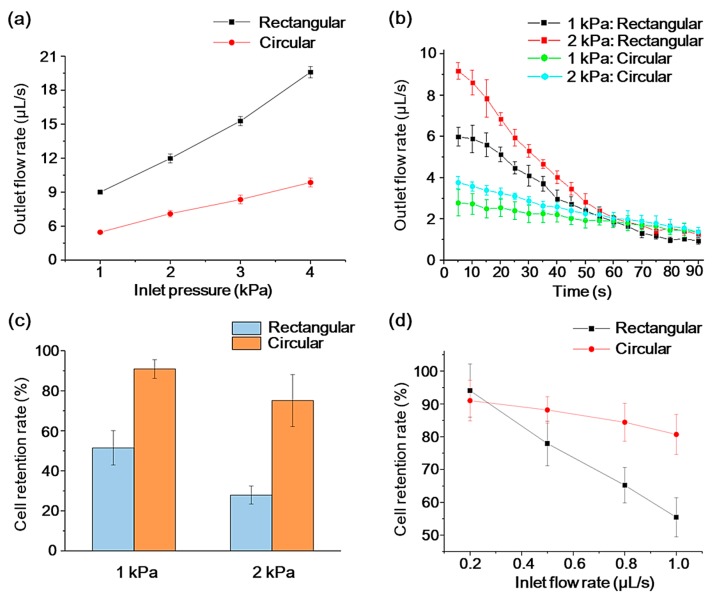
Figure 5.
(a) PBS buffer flow characterization of two sieves with increasing inlet pressure. (b) Real-time changes in outlet flow rate with 2 × 10⁵ cells/mL buffer sample under two pressure conditions. The error bars represent the standard deviation for n = 3. (c) Cell retention rate of two sieves under two pressure conditions. (d) Cell retention rate of two sieves under different constant inlet flow rate. The error bars represent the standard deviation for n = 5.

