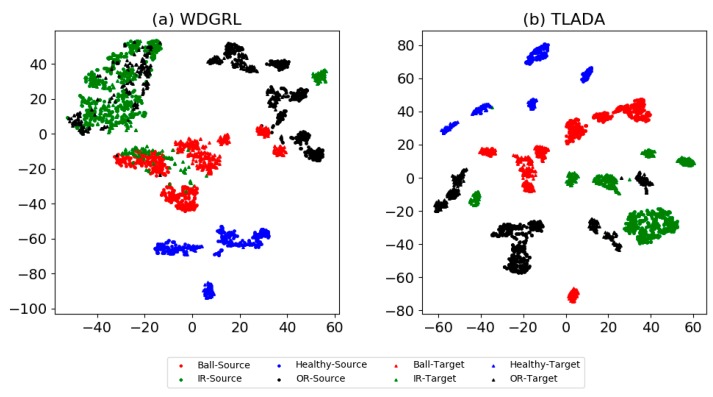
Figure 5.
t-SNE results of task ‘FE -> DE’ on CWRU dataset through method (a) WDGRL, (b) TLADA. To better inspect the class-level alignment between domains, we draw the features of both the source domain and the target domain into single images. Two shapes represent two domains (square for source domain and triangle for target domain), and four colors with numbers represent four classes.

