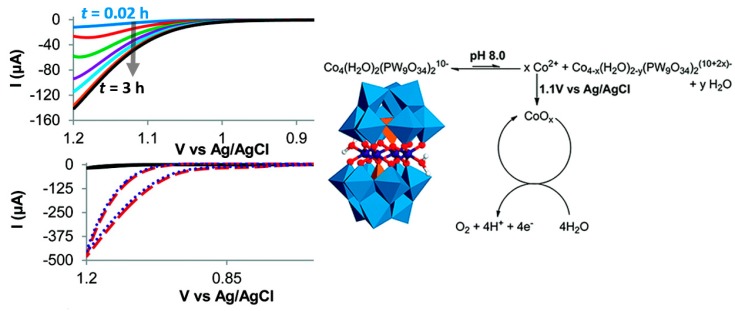
Figure 5.
Left top: time-dependent LSV curves of {Co4} (0.5 mM) in aqueous sodium phosphate buffer (pH 8.0). Left bottom: CV scans of of {Co4} (0.5 mM) in aqueous sodium phosphate buffer (pH 8.0) immediately after dissolving (black), after 30 min electrolysis at 1.1 V versus Ag/AgCl (red dashed) and of the rinsed electrode after 30 min electrolysis at 1.1 V versus Ag/AgCl, immersed in a pure aqueous sodium phosphate buffer (pH 8.0, blue dotted). Adapted from [76] with permission; copyright 2011, American Chemical Society.

