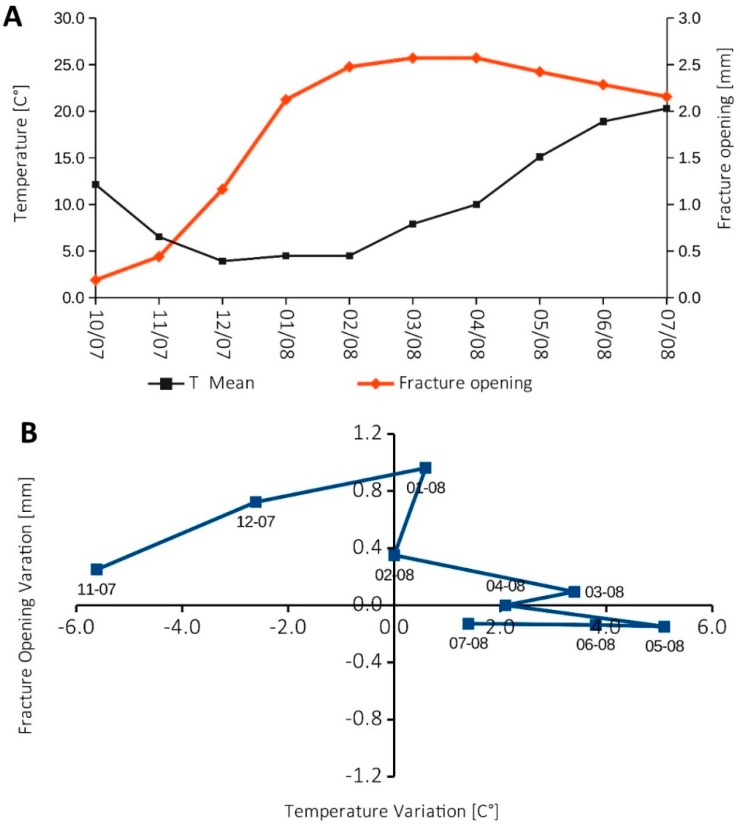
Figure 4.
(A) shows the monthly averaged temperature [°C] and fracture opening [mm] from October 2007 to July 2008; (B) reports a plot of the variation of the fracture opening [mm] as a function of the temperature variation [°C], calculated on a monthly temporal scale for the period October 2007–June 2008; data source: wire extensometers of ARPA Piemonte.

