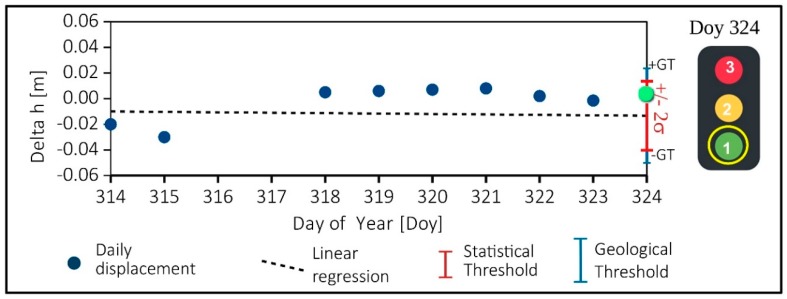
Figure 8.
An example, using a simulated dataset, of daily solution for vertical displacement (Delta h). In the Day of Year 324, the displacement (green dot) is an insight into the statistical threshold (±2σ on the regression line) and below the geological threshold (GT). This means that normal conditions (green light–flag = 1). The days 316 and 317 have no measure because the ratio test was <4.

