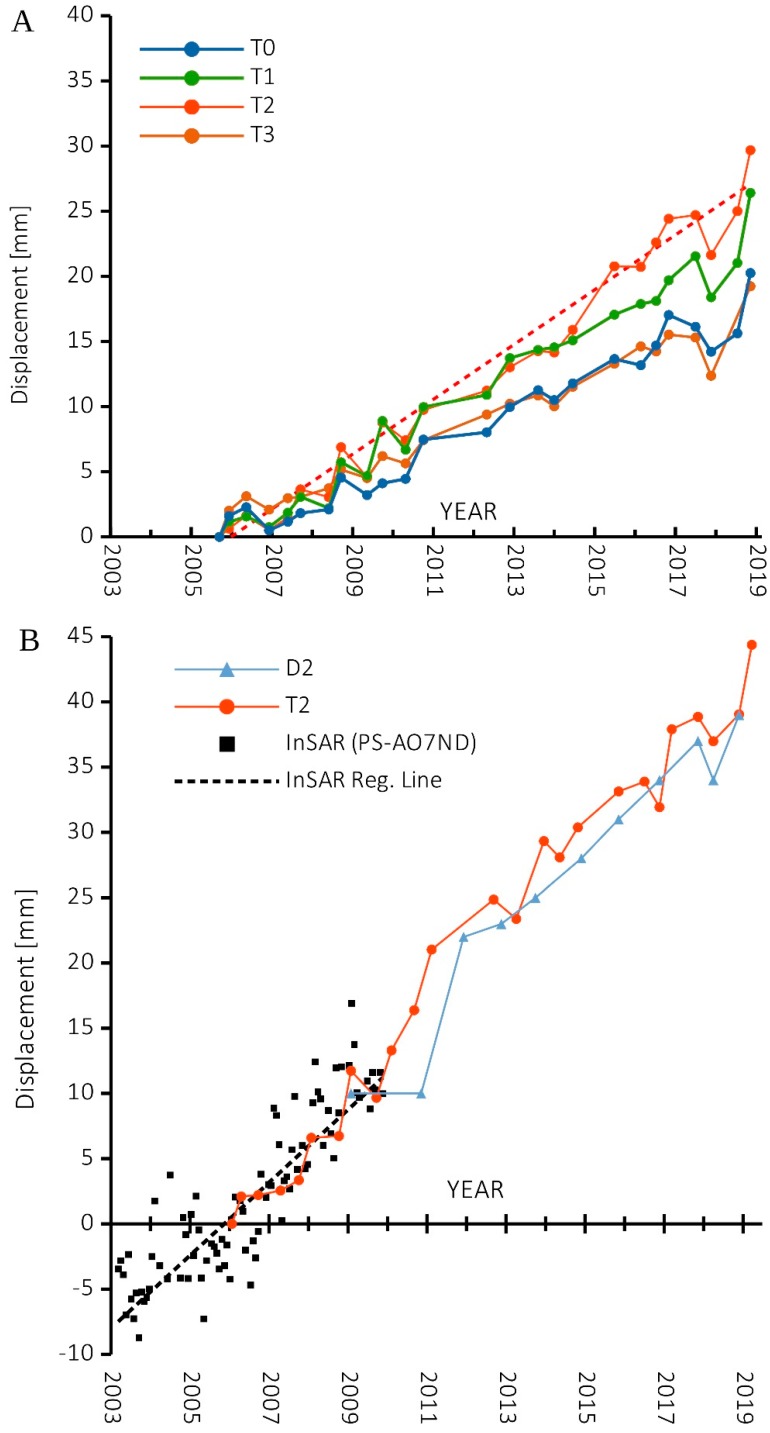
Figure 10.
(A) shows the Time Series of 2D (horizontal) displacement of the topographic benchmarks (T0, T1, T2, T3) and the linear regression represented as red dashed line for T2 (the equation is f(x) = 0.006x − 224.3; R2 = 0.97; (B) shows the 3D time-series displacement of: benchmark T2; the laser distance meters D2; the PS InSAR data (PS id: AO7ND Radarsat ascending dataset) with its linear regression represented by the black dashed line (the equation is f(x) = 0.008x − 295.3; R2 = 0.77).

