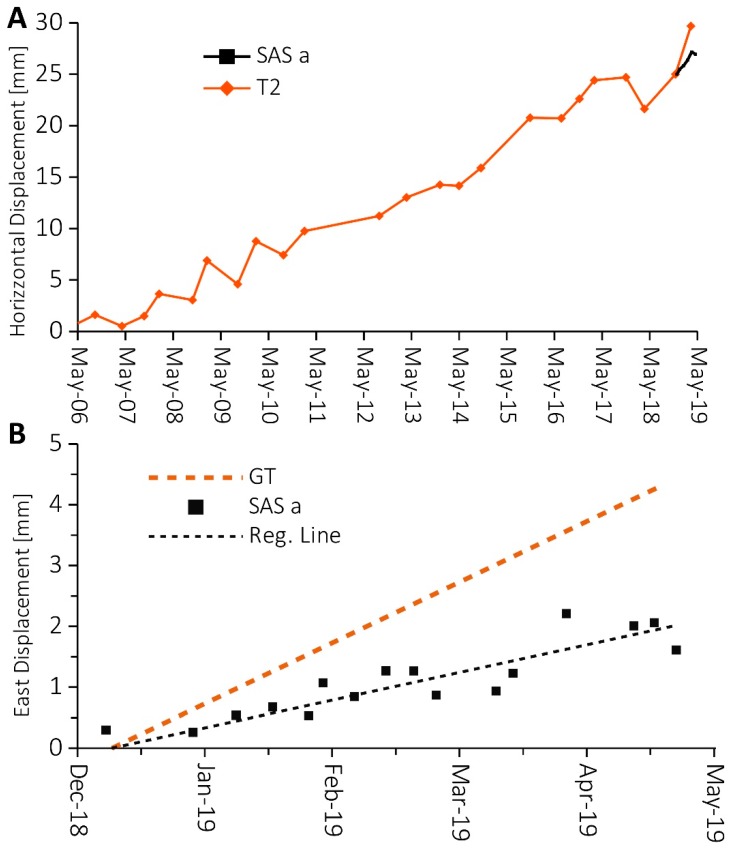
Figure 12.
(A) shows a comparison of horizontal displacement between GNNS “SAS a” based on weekly averaged measurements from December 2018 to May 2019 and topographic “T2” for the period 2006–2019; (B) shows GNSS “SAS a” East displacement averaged with weekly sampling and its regression line (equation f(x) = 0.01x − 634.47; R2 = 0.86) compared with geological thresholds (GT) of 3 mm/100 days (11 mm/year).

