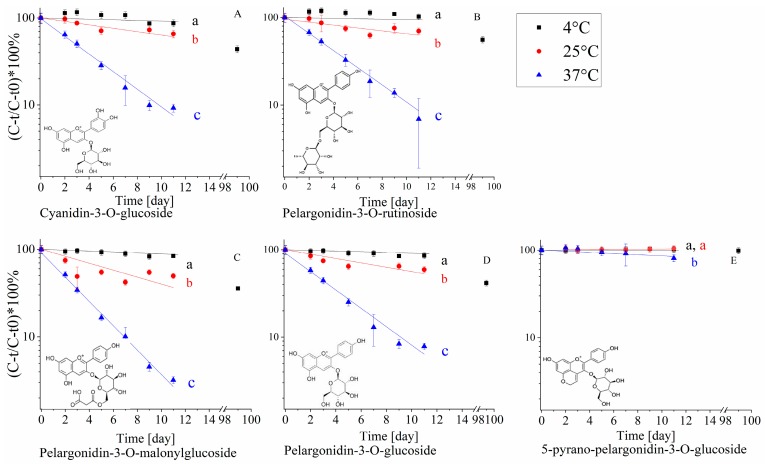
Figure 3.
Relative concentration (quantified by HPLC at 520 nm) of the anthocyanins in the extract during shelf-life at different temperatures (4 °C, 25 °C and 37 °C, citric buffer pH = 3, 50 mM) (A) Cyanidin-3-O-glucoside, (B) Plargonidin-3-O-rutinoside, (C) Pelargonidin-3-O-malonylglucoside, (D) Pelargonidin-3-O-glucoside, (E) 5-Pyranopelargonidin-3-O-glucoside. * Error bars represent standard error (n = 2), the lines represent a fit to first-order kinetics. * Small letters near the regression line represent significant differences (p < 0.05), according to the colors in the legend.

