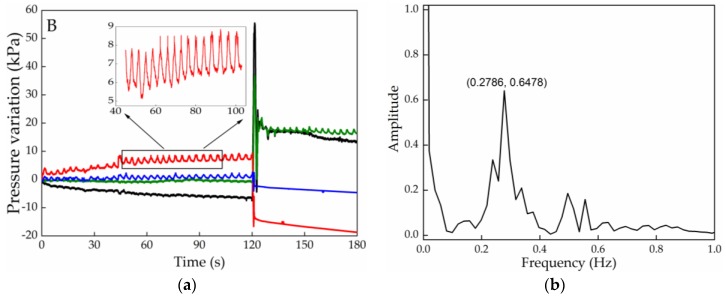
Figure 8.
(a) Pressure variation registered in different cells, highlighting the SL cell results, during the pressure relief exercise B; (b) Fourier transform applied to the optical signal detected by the SL and highlighted in Figure 8a, for wheelchair user breathing rate determination.

