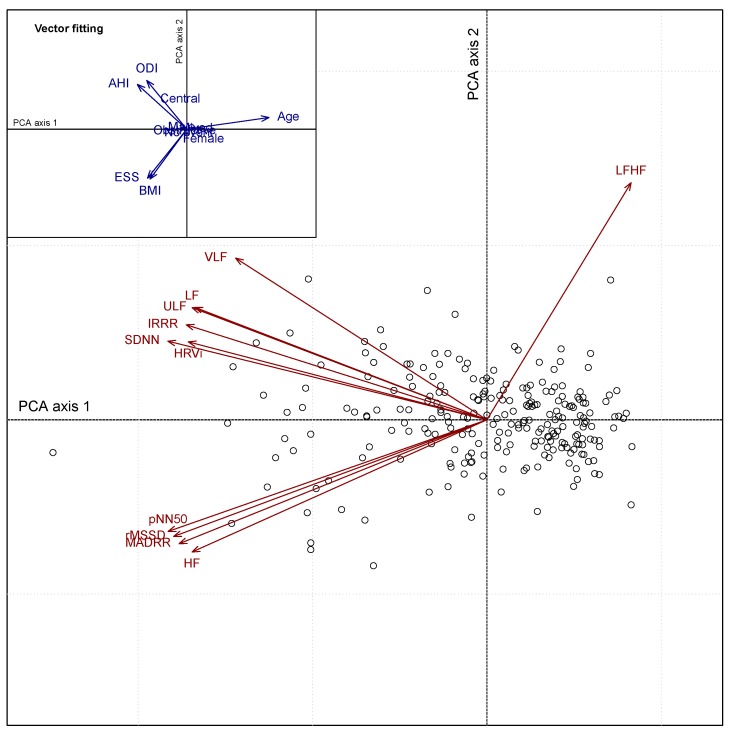
Figure 1.
PCA biplot representation of the HRV features (red arrows) and patient information (empty circles) derived from filtered ECG belt data. External explanatory variables including patient baseline characteristics were fitted to the PCA for interpretation purposes and represented by blue arrows oriented towards the direction of maximum correlation (inset on the upper left corner).

