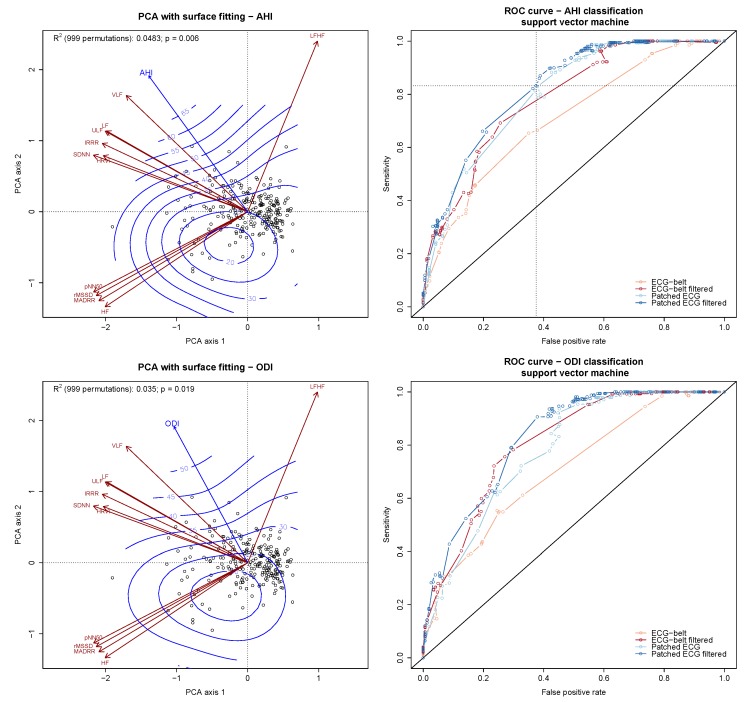
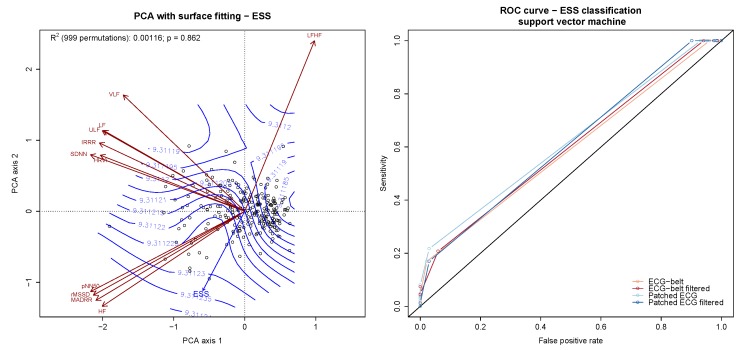
Figure 3.
Predictive and diagnostic accuracy of the HRV features with regards to AHI, ODI and ESS. The predictive accuracy of the HRV features is provided by surface fitting applied to PCA (left panels). The isoclines (blue lines) superimposed to the PCA biplot display the linear relationship (trend surface) between HRV features and the responses (AHI, ODI, ESS; blue arrows). The diagnostic accuracy is shown by means of ROC curve displaying the sensitivity vs. false positive rate of a support vector machine-based AHI classifier (right panels). The curves are derived from ECG data obtained during PSG and ECG belt with or without data pre-filtering. The diagonal line indicates the random guess line. The dotted lines of the upper right panel cross at the optimal classification accuracy for AHI (AHI = 18 ).


