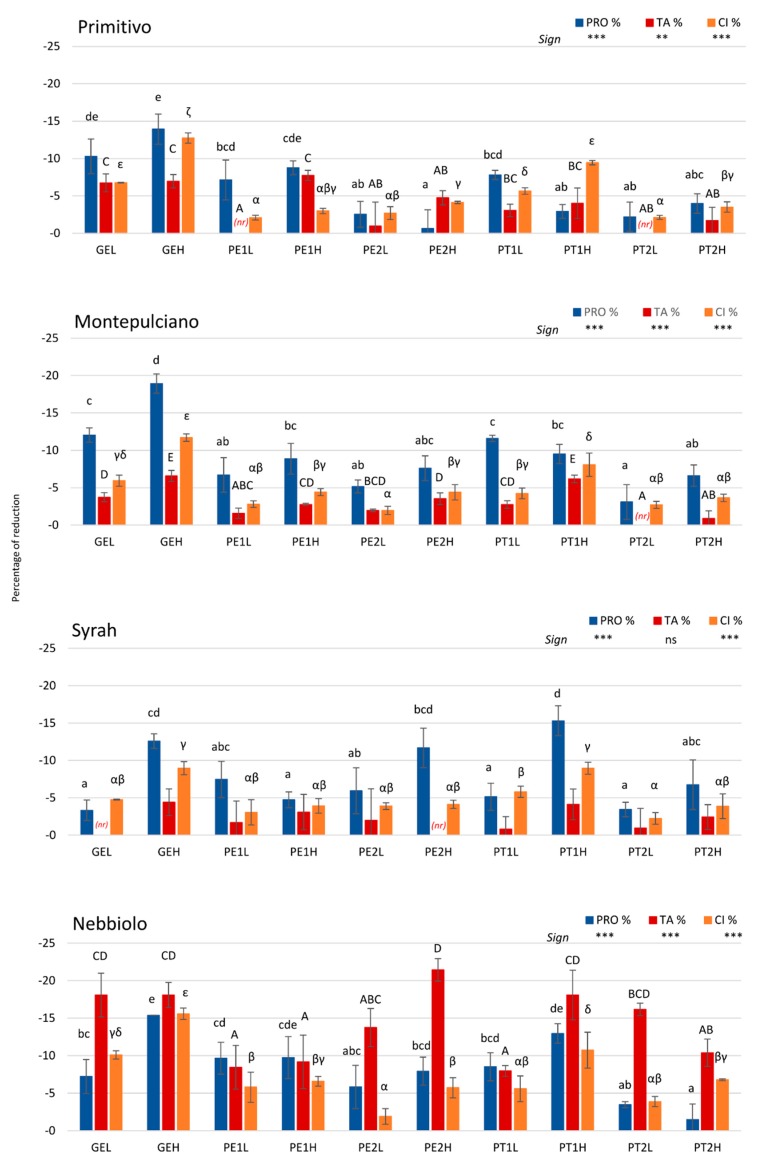
Figure 1.
Reduction percentage of wine proanthocyanidins (PRO) after fining treatments with proteins of animal origin like gelatin (GE) and of vegetal origin from pea (PE1, PE2) and potato (PT1, PT2) with respect to the untreated wine, compared to reduction percentage of total anthocyanins (TA) and color intensity (CI). All data are expressed as the average value of individual treatments with respect to the control ± standard deviation (n = 3). Different lowercase Latin letters for PRO, different uppercase Latin letters for TA, and different lowercase Greek letters for CI indicate significant differences among treatments according to Tukey test (p < 0.05), respectively. Sign: **, ***, and ns indicate significance at p < 0.01, 0.001, and not significant, respectively. GE = Gelatin, PE1 = Pea 1, PE2 = Pea 2, PT1 = Potato 1, PT2 = Potato 2, L = low dose, H = high dose, (nr) = no reduction occurred.

