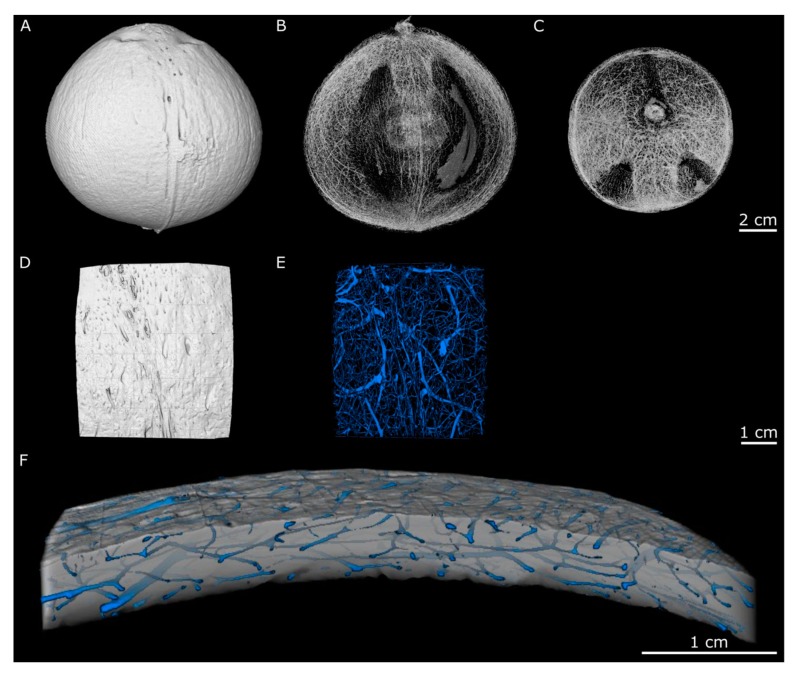
Figure 2.
µCT reconstructions of a coconut fruit scanned at two resolutions: 150 µm (A–C) and 42 µm (D–F). Side view of the coconut endocarp showing the outer surface (A) and the course of the vascular bundles (B). Top view of the endocarp with highlighted vascular bundles (C). Top view of a smaller endocarp volume scanned at higher resolution showing the outer surface (D) and the course of the vascular bundles (E). The higher magnification also reveals smaller vascular bundles, which span a strongly branched network between the larger vascular bundles. In the enlarged side view of the smaller endocarp volume, the vascular bundles are observed running almost parallel to the outer surface of the endocarp (F). Images (B,C) are kindly provided by the Shimadzu Corporation.

