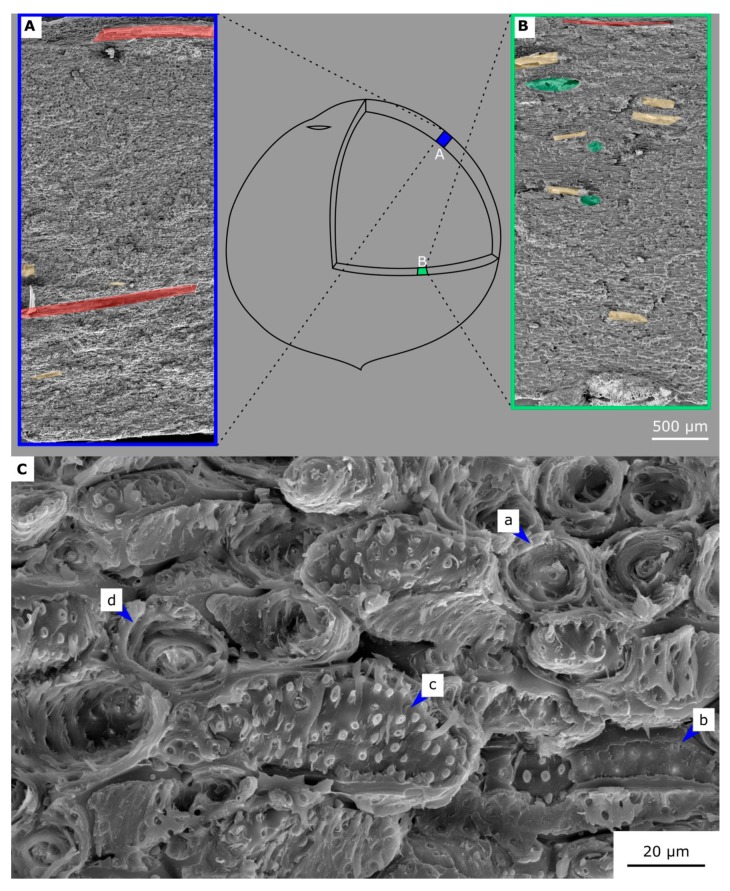
Figure 11.
SEM images of fracture surfaces broken in meridional/sagittal plane (A) and equatorial/transverse plane (B). Vascular bundles parallel to the fracture surface are marked red, the perpendicular ones are green, and the oblique ones are yellow. The detail of a broken sclereid cell matrix (C) highlights the four failure modes (modified after [5]: Cell tearing (a), middle lamella breakage (b), cell wall breakage (c), and pull-out of elongated cells (d).

