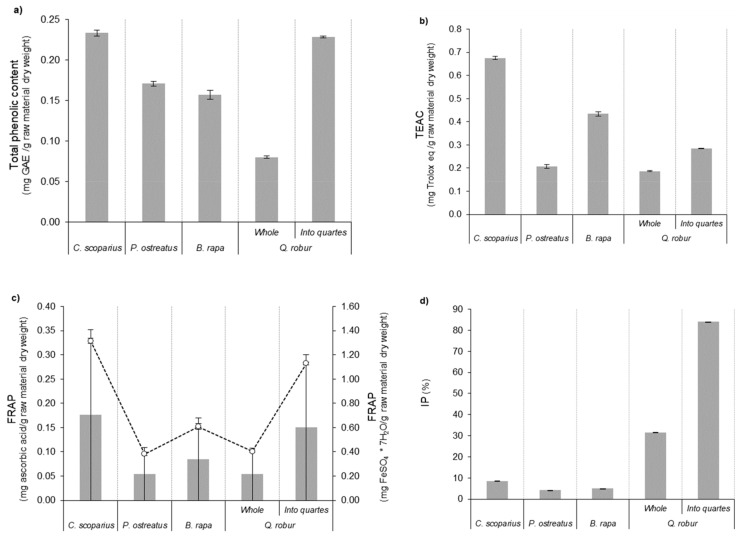
Figure 2.
Total phenolic content (a) and antioxidant capacity, expressed as TEAC value (b), FRAP assay (c) as ascorbic acid equivalents (circles) and as ferric sulphate equivalents (bars) and inhibition percentage (IP) of DPPH radical (d), from the aqueous collected of the different took in consideration raw materials at 100 W by MHG extraction.

