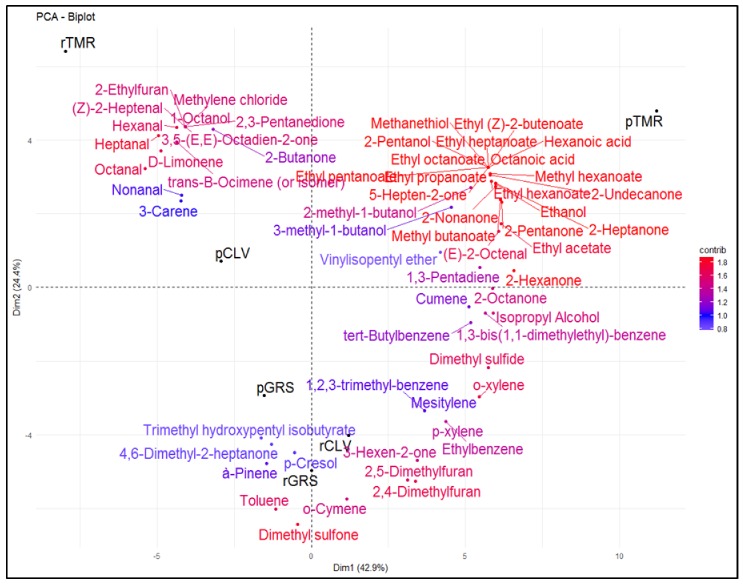
Figure 3.
Principal component analysis (PCA) Biplot of raw (r) and pasteurized (p) grass (GRS), clover (CLV) and total mixed ration (TMR) milk samples and the top 60 volatile compounds contributing to the differences between the samples, identified by HS-SPME GCMS. Color gradient; low = white, mid = blue and high = red, midpoint set at 1.0.

