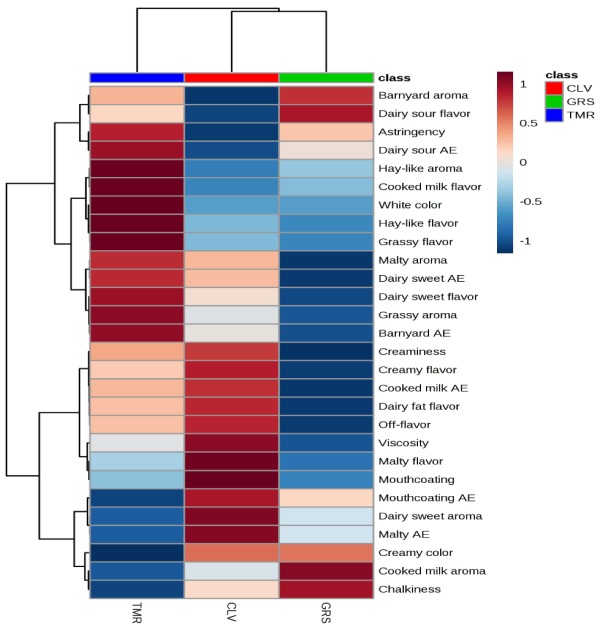
Figure 5.
Hierarchal clustering analysis (Heatmap) of the average values for each sensory descriptor applied to the 3 pasteurized milk samples (grass (GRS), clover (CLV) and total mixed ration (TMR)) as determined by full descriptive sensory analysis (n = 7). Positive and negative correlations between diet treatment and sensory descriptors is denoted by +1 (red) and −1 (blue). AE: aftereffect.

