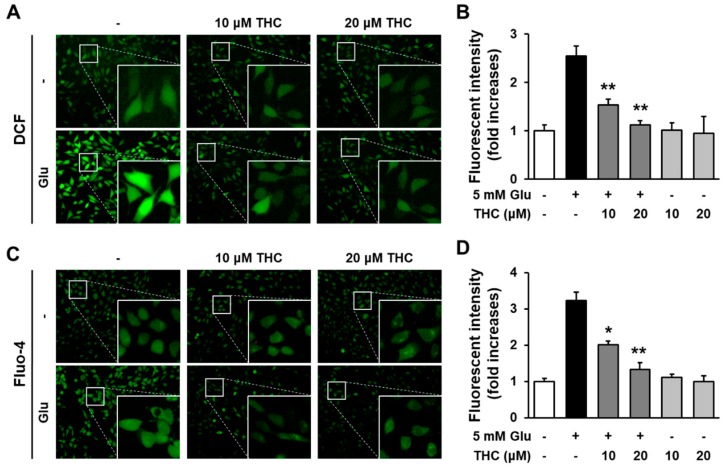
Figure 3.
THC diminished the increase in intracellular ROS and Ca2+ via its antioxidant activity. (A) Cells were treated with 5 mM glutamate with or without 10 or 20 μM THC for 8 h and stained with H2DCF-DA. Green indicates DCF fluorescence (20×). (B) Bars denote the ROS levels measured by fold-increases in the fluorescent intensity of DCF (** p < 0.001 compared to glutamate-treated cells). (C) Cells were treated with 5 mM glutamate with or without 10 or 20 μM THC for 8 h and stained with Fluo-4 AM for an additional 30 min. Green fluorescence indicates DCF active cells (20×). (D) Bars denote the levels of [Ca2+]i measured by fold-increases in the fluorescent intensity of Fluo-4 (* p < 0.05 and ** p < 0.001 compared to glutamate-treated cells).

