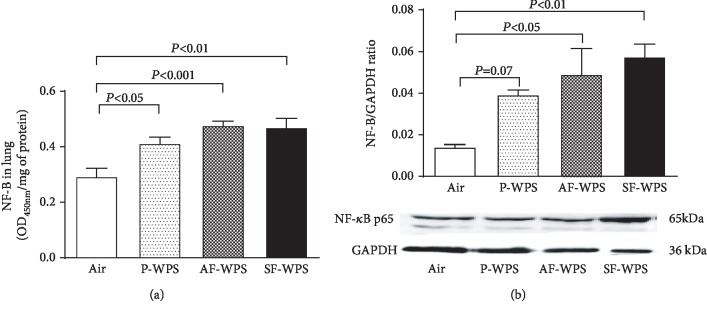
Figure 8.
(a) Nuclear factor kappa-B (NF-κB) levels in the lung tissues quantified by ELISA, at the end of a one-month exposure period to either air (control, n = 7) or plain (P-) waterpipe smoke (WPS, n = 7) or apple-flavoured (AF-) WPS (n = 7) or strawberry-flavoured (SF-) WPS (n = 6). (b) Western blot analysis and graphic representation of NF-κB protein levels in the lung tissues, at the end of a one-month exposure period to either air (control, n = 5) or plain (P-) waterpipe smoke (WPS, n = 5) or apple-flavoured (AF-) WPS (n = 5) or strawberry-flavoured (SF-) WPS (n = 5). Data are expressed as mean ± SEM.

