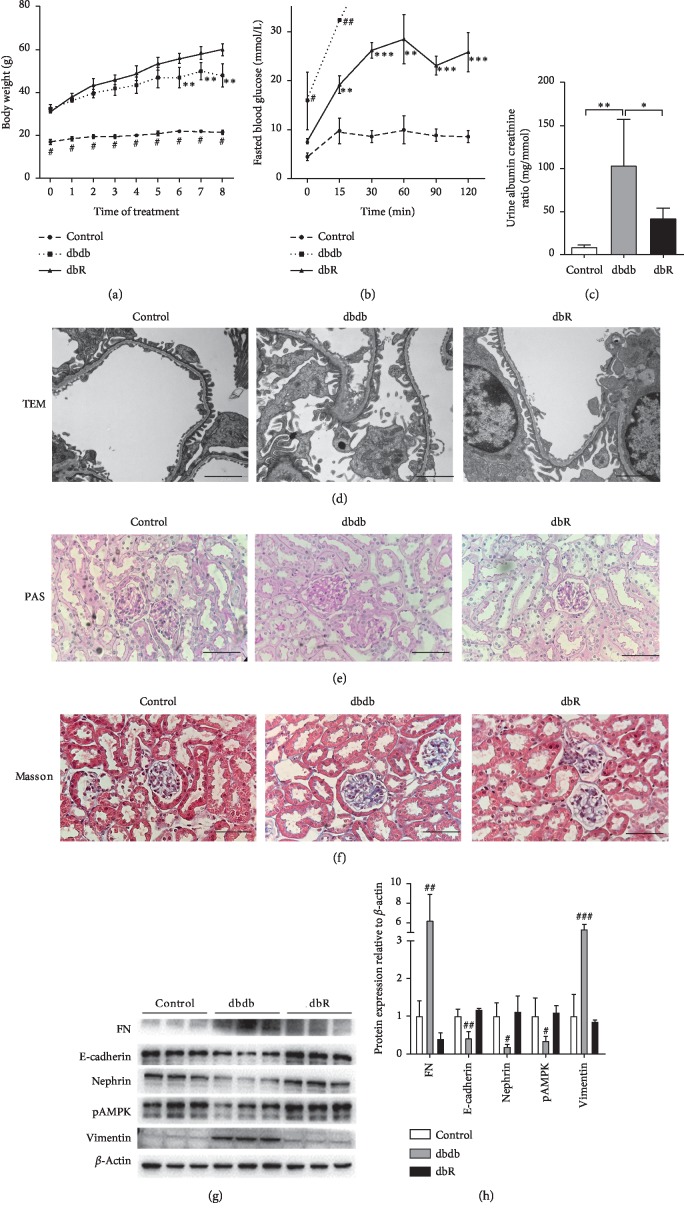
Figure 1.
Rosiglitazone treatment protected against diabetic nephropathy in db/db mice. (a) Body weight levels were evaluated weekly in the control, dbdb, and dbR groups. Data are presented as the mean ± SEM (n = 6 per group). #P < 0.001 compared to the other groups at the same time point, ∗∗P < 0.01 compared to dbR at the same time point. (b) Intraperitoneal glucose tolerance test (IPGTT) in rosiglitazone-treated and untreated control and db/db mice. After eight weeks of treatment with rosiglitazone, mice were fasted for 16 hours and injected with glucose (1.5 g/kg I.P). Blood glucose levels were measured at 0 min, 15 min, 30 min, 60 min, 90 min, and 120 min after injection. The data omitted in the dbdb group are due to blood glucose levels above the upper limit of instrument detection. ∗∗P < 0.01 compared to the control group; ∗∗∗P < 0.001 compared to the control group; #P < 0.05 compared to the other two groups; ##P < 0.01 compared to the other two groups. Data are represented as mean ± SEM. n = 6 per group. (c) After 8 weeks of treatment, urinary albumin creatine ration (ACR) in control, dbdb, and dbR mice was determined. n = 6 per group. ∗P < 0.05, ∗∗P < 0.01, as indicated. Representative photomicrographs depicting (d) transmission electron microscope (TEM), (e) periodic acid-Schiff (PAS) staining, and (f) Masson's trichome staining in the control, dbdb, and dbR groups after the 8-week experimental period. Scale bars: (d) 2 μm and (e, f) 50 μm. (f) Western blot analysis of fibronectin (FN), E-cadherin, nephrin, pAMPK, vimentin, and β-actin expression in the renal cortices of control, dbdb and dbR mice. (g) Densitometric analysis of western blot results. (h) Relative band intensity was normalized to the β-actin signal. Data are presented as the mean ± SEM (n = 6 per group). #P < 0.05, ##P < 0.01, ###P < 0.001, as compared to the other groups.

