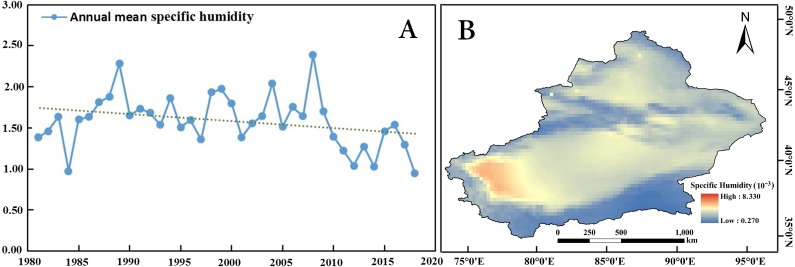
Figure 4. Spatiotemporal changes in the annual specific humidity in Xinjiang from 1981 to 2018.
(A) Anomalies in the annual specific humidity in Xinjiang. (B) Distribution of the specific humidity in Xinjiang. Map credit: © State Key Laboratory of Desert and Oasis Ecology, Xinjiang Institute of Ecology and Geography, Chinese Academy of Sciences; CC BY NC 4.0.

