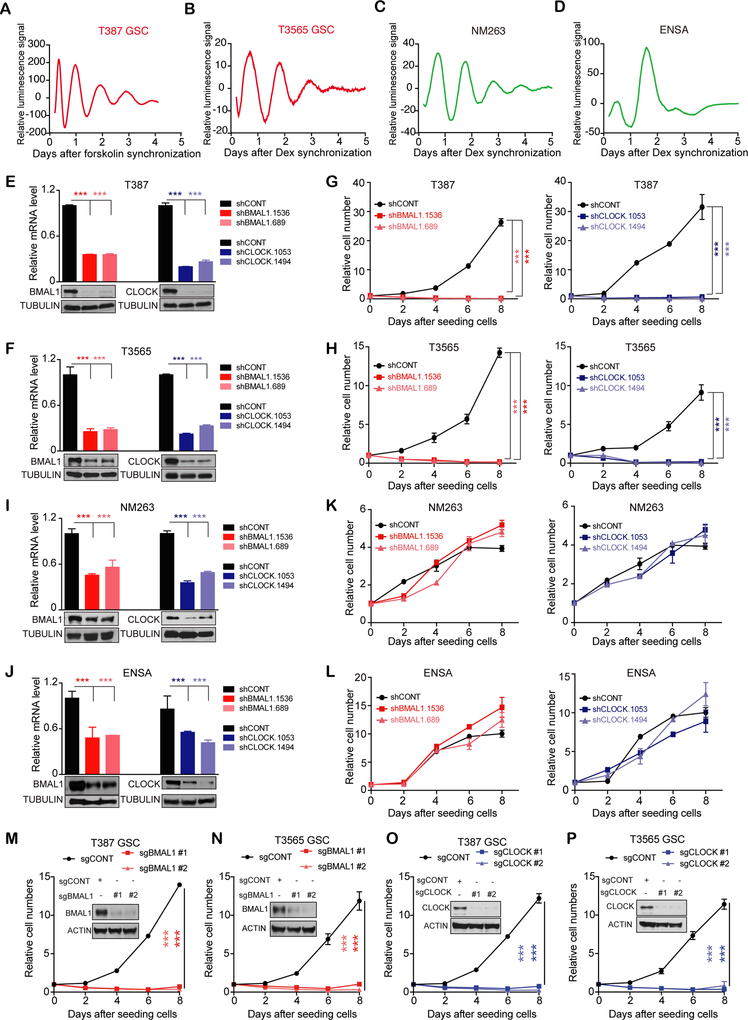
Figure 1. Genetic disruption of core clock genes suppresses GSC growth despite robust circadian oscillation.
(A-D) Bioluminescence of BMAL1::Luc in T387 (A) and T3565 (B) GSCs, non-malignant brain cultures (C), NSC (ENSA) (D), synchronized by 100 nM dexamethasone or 10 μM forskolin. Data are representative of three experiments.
(E and F) mRNA and protein expression of BMAL1 and CLOCK in T387 (E) and T3565 (F) GSCs transduced with shCONT, shBMAL1 or shCLOCK. Data are presented as mean ± SD. ***, P< 0.001. Statistical significance was determined by one-way ANOVA with Tukey’s multiple comparison. N=3.
(G and H) Relative cell numbers of T387 (G) and T3565 (H) GSCs transduced with shCONT, shBMAL1 or shCLOCK. Data are presented as mean ± SD. ***, P< 0.001. Statistical significance was determined by two-way ANOVA with Tukey’s multiple comparison. N=4.
(I and J) mRNA and protein expression of BMAL1 and CLOCK in non-malignant brain cultures (NM 263) (I) and NSC (ENSA) (J) transduced with shCONT, shBMAL1 or shCLOCK. Data are presented as mean ± SD. ***, P< 0.001. Statistical significance was determined by one-way ANOVA with Tukey’s multiple comparison. N=3.
(K and L) Relative cell numbers of non-malignant brain cultures (K) and NSCs (L) transduced with shCONT, shBMAL1 or shCLOCK. Data are presented as mean ± SD. ***, P< 0.001. Statistical significance was determined by two-way ANOVA with Tukey’s multiple comparison. N=4.
(M-P) Protein expression of BMAL1 or CLOCK and relative cellular numbers in GSCs transduced with Cas9-sgCONT, Cas9-sgBMAL1 (M and N) or Cas9-sgCLOCK (O and P). Data are presented as mean ± SD. ***, P< 0.001. Statistical significance was determined by two-way ANOVA with Tukey’s multiple comparison. N=3.

