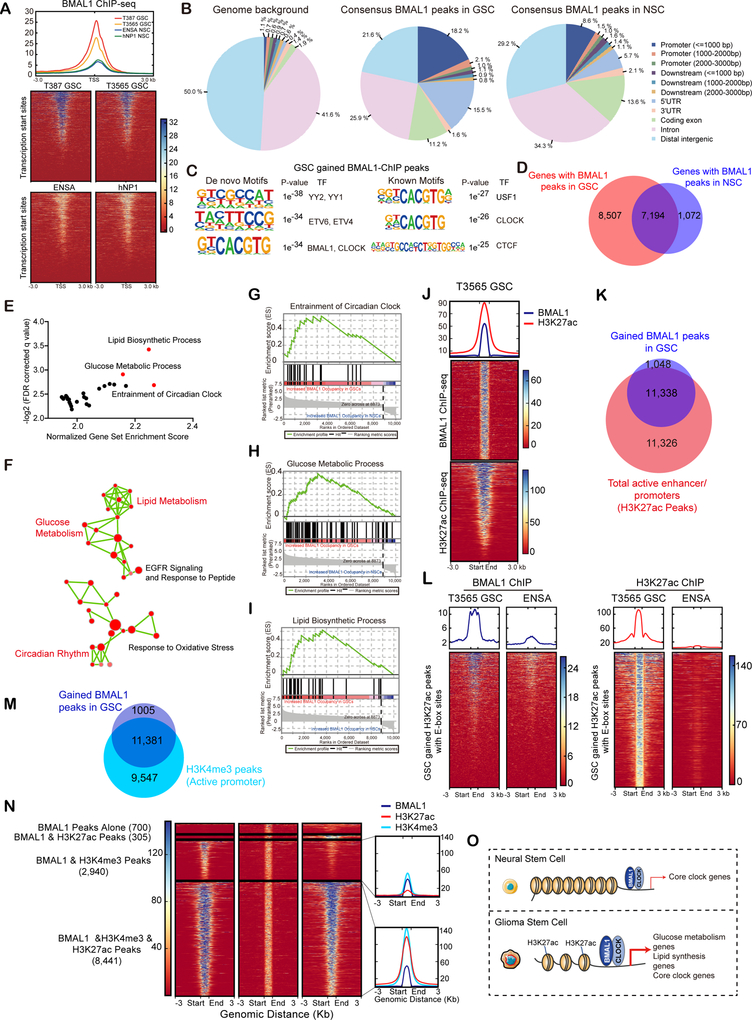
Figure 3. BMAL1 exhibits aberrant genome-wide binding patterns in GSCs compared to NSCs.
(A) Binding profiles and heatmaps for BMAL1 ChIP-seq signals in GSCs (T387 and T3565) and NSCs (ENSA and hNP1). ChIP-seq signals are displayed within a region spanning ±3 kb around all canonical transcription start sites (TSS) genome-wide.
(B) Distribution of genomic annotations of BMAL1 peaks in GSCs (middle panel) and NSCs (right panel) with background shown in left panel. Consensus peaks were derived by selecting all peaks present in both replicates of respective cell types.
(C) Motif analysis of GSC-gained BMAL1 binding sites as defined in (Figure S4C). Both de novo (left) and known consensus (right) motifs are shown with corresponding enrichment significance values.
(D) Venn diagram showing the overlap between BMAL1 binding genes in GSCs and NSCs ±3 kb around the TSS.
(E and F) Gene set enrichment analysis (GSEA) (E) and pathway enrichment bubble plots (F) of genes with GSC-gained BMAL1 peaks ±3 kb around the TSS.
(G-I) GSEA plots of genes involved in circadian rhythm (G), glucose regulation (H) and lipid metabolism (I) with increased BMAL1 binding in GSCs relative to NSCs.
(J) Heatmaps showing correlation of BMAL1 and H3K27ac ChIP-seq in T3565 GSCs. All ChIP-seq signals are displayed from ±3 kb surrounding each annotated BMAL1 peak.
(K) Venn diagram showing the overlap between gained BMAL1 and H3K27ac peaks in T3565 GSCs.
(L) Heatmaps displaying BMAL1 and H3K27ac ChIP-seq signals across GSC-gained H3K27ac peaks containing an E-box motif.
(M) Venn diagram showing the overlap between GSC-gained BMAL1 peaks and H3K4me3 peaks in GSCs.
(N) Heatmaps showing correlation of BMAL1, H3K4me3 and H3K27ac ChIP-seq in GSCs.
(O) Schematic showing differential BMAL1 chromatin binding in NSCs and GSCs.

