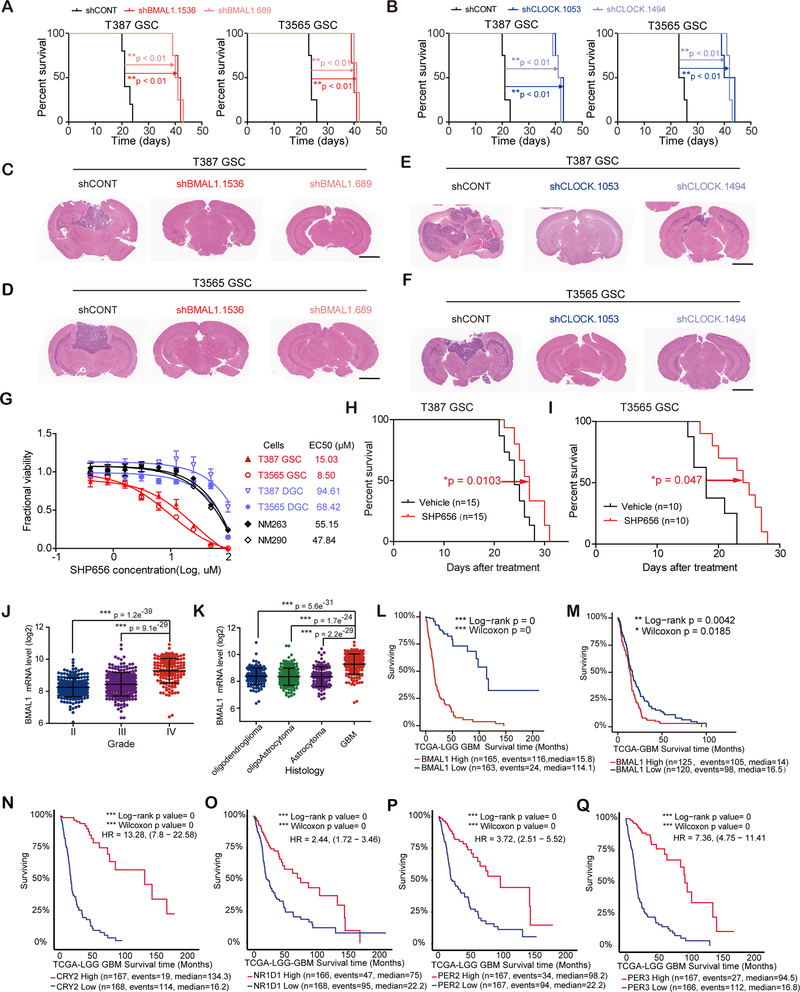
Figure 7. Targeting core clock components suppresses in vivo tumor growth.
(A and B) Kaplan-Meier survival curves of immunocompromised mice bearing GSCs transduced with shCONT (N = 5), shBMAL1 (N = 4) (A) or shCLOCK (N = 4) (B). Statistical significance was determined by Mantel-Cox log-rank test.
(C-F) H&E staining of tumor-bearing brains following implantation of GSCs transduced with either shCONT, shBMAL1 (C and D) or shCLOCK (E and F). Scale bar is 2 mm.
(G) Concentration-response curves and EC50 of GSCs (T387 and T3565), DGCs (T387DGC and T3565DGC), non-malignant brain cultures (NM263 and NM290) and astrocytes (NHA) treated with different concentrations of SHP656 (x axis, log scale) for 3 days. N=3.
(H and I) Kaplan-Meier survival curves of mice bearing T387 GSC (H) or T3565 GSC (I) treated with SHP656. 15 mice were used per arm for T387 GSC and mice were treated BID (twice a day) at 10mg/Kg. 10 mice were used per arm for T3565 GSC and mice were treated QD (once a day) at 10mg/Kg. Statistical significance was determined by Mantel-Cox log-rank test.
(J and K) BMAL1 mRNA level in different grades (J) or histologies (K) of glioma patients from TCGA dataset. Data are presented as mean ± SD. Statistical significance of sphere numbers was determined by one-way ANOVA with Tukey’s multiple comparison.
(L and M) Kaplan-Meier survival curves of patients with higher or lower BMAL1 expression in low grades of glioma and glioblastoma (L) or glioblastoma alone (N). Statistical significance was determined by Mantel-Cox log-rank test.
(N-Q) Kaplan-Meier survival curves of patients with higher or lower CRY2 (N), NR1D1 (O), PER2 (P) or PER3 (Q) expression in low grades of glioma and glioblastoma. Statistical significance was determined by Mantel-Cox log-rank test.

