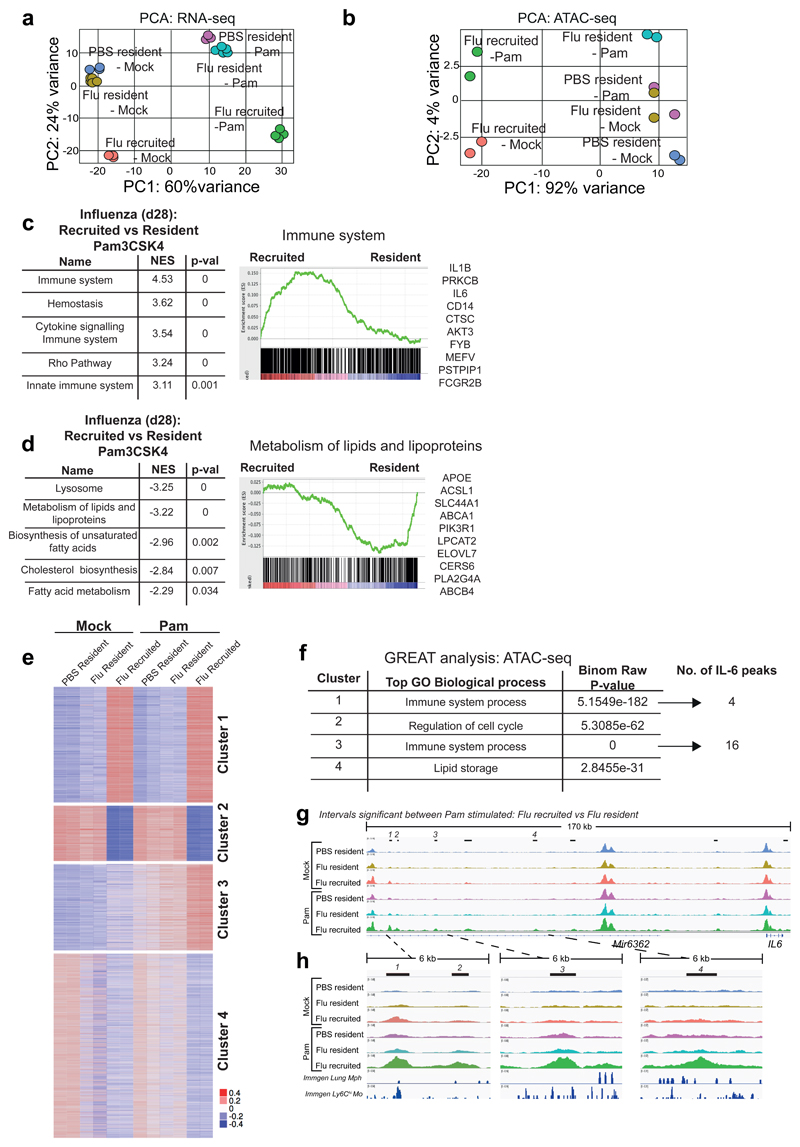
Figure 6. Following TLR stimulation, origin determines gene expression, chromatin profile and IL-6 gene accessibility.
AMs were FACS-sorted based on congenic markers from the lungs of naïve and post-influenza Busulfan chimeras, and stimulated ex vivo with Pam3CSK4. PCA plot of (a) RNA-seq data and (b) ATAC-seq data from unstimulated and Pam3CSK4-stimulated CD45.2 (Ccr2-/-) resident and CD45.1 recruited AMs. c,d, Top 5 pathways (FDR q-val <0.01) from GSEA of Pam3CSK4 stimulated AMs from post-influenza lungs. NES = Normalized Enrichment Score. Representative GSEA plots are shown, with the top 10 highest ranked genes from each GSEA listed. e, ATAC-seq data as in (b) shown as heatmap of mean centred k-means clustering of rlog values generated by DESeq2 for differentially accessible intervals found to be significant (FDR ≤ 0.01) in at least one pairwise comparison. f, GREAT analysis of ATAC-seq-derived intervals from each cluster in (e). g,h, IGV tracks of ATAC-seq data for AMs, showing the IL-6 locus and upstream peaks. Significantly differentially accessible intervals in the comparison Flu_resident_Pam vs Flu_recruited_Pam are marked using bars. ImmGen chromatin tracks from lung macrophages and blood Ly6Chi monocytes are shown underneath (h). All tracks were group-autoscaled to enable comparison.

