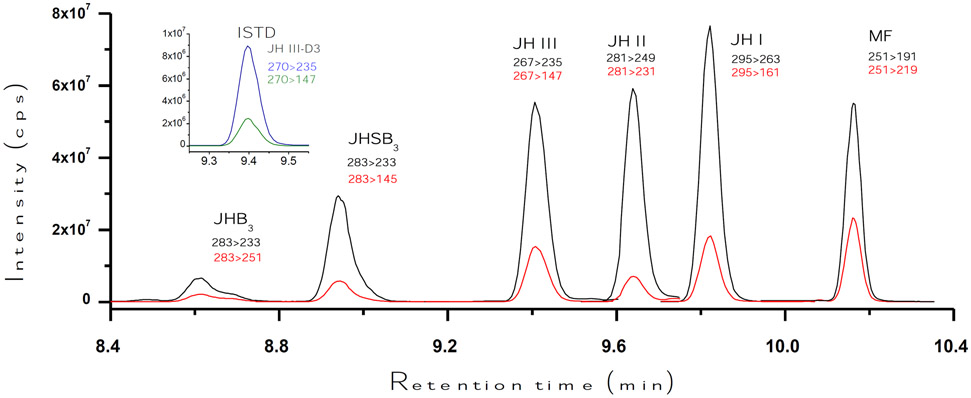
Fig. 2: LC separation of JH homologues:
Typical LC-MS/MS peaks of JH homologues and MF. It shows the relationships between the retention times in minutes (X axis) and the signal intensity (cps; counts per second) (Y axis). Injected mass was 125 pg (325 pg for MF and 32 pg for the internal standard –ISTD-). Retention times are in minutes. Black lines represent the signal intensity of the primary transition, and red lines represent the intensity of the secondary transition. The inset shows the corresponding chromatograms for JH III-D3 (blue is the primary and green is the secondary transitions).

