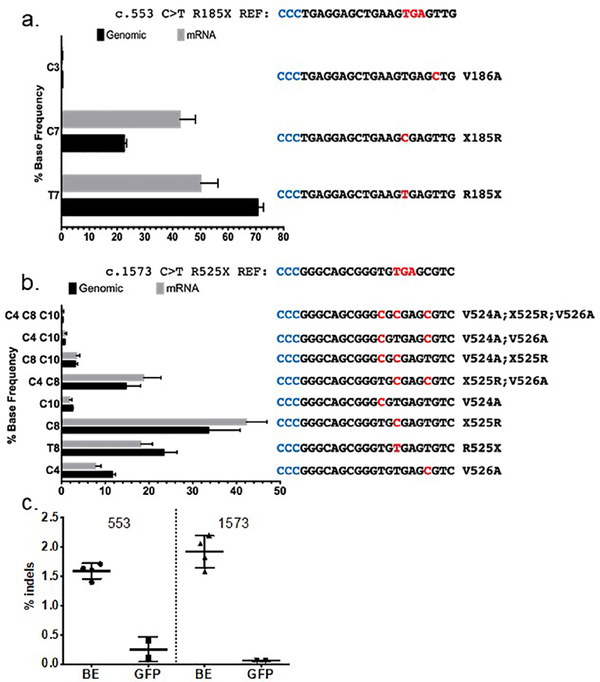
Figure 3. Allele frequencies following ABE treatment.
a COL7A1 c.553 C>T allelic analysis. The mean percentage of each individual edited DNA and mRNA sequence is shown. Amino acid changes and base alterations corresponding to the observed outcomes are shown at right (3’−5’) with PAM (anti-sense) colored in blue. b Allele distribution in c.1573 C>T cells following base editing. The mutation reference sequence is shown at top. A bar graph of edited cells and the frequency of alleles observed in genomic or mRNA derived cDNA is shown. At right are the individual allele sequences (3’−5’) identified following base editing, with altered bases highlighted in red and PAM in blue. Allelic variants occurring at less than 0.2% frequency, approximately the frequency of sequencing errors, were not included in the analysis and therefore the values for the graphs are <100%. c COL7A1 locus insertions and deletions from base editing. The percentage of deep sequencing reads with indels are shown for treated (BE) and control cells transfected with GFP for the c.553 and c.1573 mutation genomic DNA, respectively. Data for each are from 5 replicates and mean and standard deviation are graphed.

